
Originally published on Progress and Poverty on December 18, 2025. Republished on Progress.org with permission.
People keep asking what they can do to further the mission of Land Value Return in their local area. I think it’s helpful to frame the whole operation as a heroic adventure. You’re an intrepid adventurer, setting off on a journey to save your land from speculation, unaffordable housing, and economic decline. You’re brave and motivated, but you may also feel unequipped, alone, and even lost. How do you begin?
Never fear, bold adventurer. Let’s guide you on your journey.

A Humble Quest
The best way to pitch Land Value Return is as a pragmatic common-sense solution to an existing problem in your community. Find a local elected who will champion the cause, then build on that base of support by doing your elected official’s homework for them. Importantly, you don’t have to wait until you’ve built a massive grassroots movement; sufficiently motivated individuals paired with the right local person in power can get a lot done.
The Chosen One(s)
Every local victory starts with local champions—someone who cares about the issue, and someone with the power to further it politically. In some cases these are the same person, in other cases the person who cares about the issue needs to find someone with the power to do something about it, such as a city councilor, mayor, state senator, etc. If you’re reading this, there’s a good chance that one or both sides of that duo is you.
You live somewhere, right? Being from somewhere gives you a superpower national advocates like us can’t match—you’re a local. When you call your politicians, you’re their constituent. When you look at a map, you recognize the streets. When you pay your property taxes or rent, you have skin in the game. This place is your home.
Don’t think you have to go it alone, however, or that you have to do it all by yourself. There may be like-minded friends and allies in your area you can invite to join your party of adventurers (more on that later).
“But,” you say, “my town or state is too small to matter in the grand scheme of things. I’m from Podunk, Nowhere. Even if we achieve reform here, what difference will it make on the national stage?” You and your neighbors will benefit, and that alone makes your cause worthwhile. But for what it’s worth, you’ll also be directly contributing to the larger movement, because our goal is to succeed anywhere.
Succeed anywhere
Our theory of change it that a steady stream of small, pragmatic, local wins throughout the country will provide the broader movement with momentum, social proof, and fresh empirical case studies. Politicians are by nature skittish, but love to follow hot new trends once they’re already proven successful. As the saying goes, “nobody wants to be the first or the last person to get off the bus.”
Given this local focus, we recommend that your first Land Value Return pitch should be framed as a voluntary opt-in for local jurisdictions, and calibrated to be revenue-neutral. This immediately takes two common attacks off the table—that the new reform will be “forced” on an entire populace who didn’t ask for it, or that it is a money-grab.
What begins as a small trickle of modest, pragmatic reforms, can grow to a rising tide and then a flood, just as we’ve seen with the YIMBY movement. Early on they relied on theoretical arguments, but as they got successive wins on the board, they were able to increasingly point to real world success stories. Each victory provides the political capital necessary for more ambitious future reforms.
So how do we achieve the change we want? By doing politicians’ homework for them.
Doing the homework
Even if your local elected officials are open and even friendly to Land Value Return, politicians are busy and easily distracted and won’t support a policy while it’s still full of risks and unanswered questions.
The bad news is that politicians simply don’t have the time and energy to do all the grunt work it takes to effectively pitch a policy. The good news is that if you’re willing to do it, it can go a long way to influencing your leaders.
Here’s a brief overview of everything that needs to be done:
- 🤝 Coalition building
- 📢 Finding stories to tell
- ⚖ Legal analysis
- 🗺 Overall strategy
- 🔍 Data modeling
Remember, you don’t have to do every single piece of this by yourself! If any of it feels intimidating, just find a piece of it you can do, and try to connect with others in your area or in the national movement to fill in the gaps. And please reach out to us at the CLE as well.
Coalition Building
Any good adventurer must form a strong party of fellow wizards and warriors if they want to make it through the dungeons alive.
YIMBYs often make for natural allies, as do Urbanists of all stripes, including your local Strong Towns conversation group. Affiliated groups like Welcoming Neighbors Network and Habitat for Humanity are good candidates as well. There are many other groups to consider as well, but the above are the easiest to start with. They may even have scheduled events at your local tavern!
For more on this, see the “Coalition Building” section of our LVT Landscape Live article.
Find the stories to tell
Politicians are going to have a lot of questions, and they’ll expect you to have the answers. If you propose shifting taxes, they’ll ask who wins, who loses, and by how much. Ideally, you’ll be able to answer that question down to the individual parcel.
Another thing you’ll discover is that elected officials don’t always know as much about the local property tax system as you might expect—it’s therefore your job to become the expert they can rely on.
At the same time, don’t drown people in data or long winded arguments. Condense your findings into a simple, high-level analysis, paired with straightforward, concrete examples that explain your reasoning in a common sense, easily relatable way.
To illustrate, let’s start at the end of the journey by showing you the kind of pitch you want to ultimately make, pulling a few key slides from a report we recently did for Spokane, Washington1.
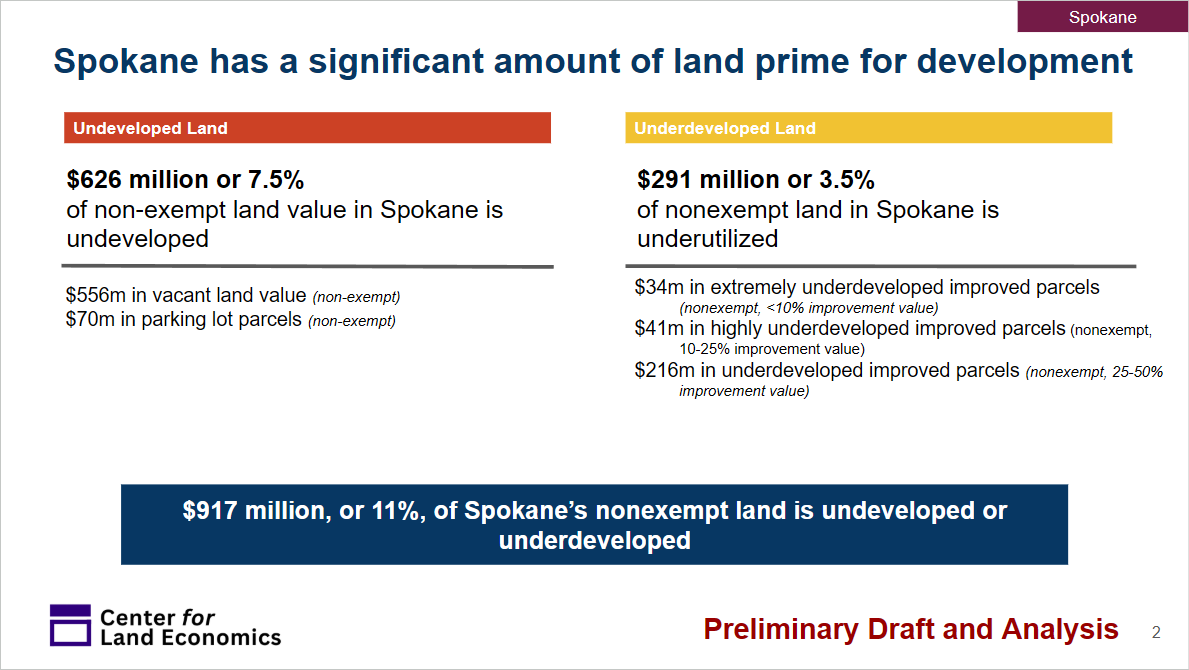
First, we open by framing the conversation around how much valuable undeveloped and underdeveloped land is just sitting there:
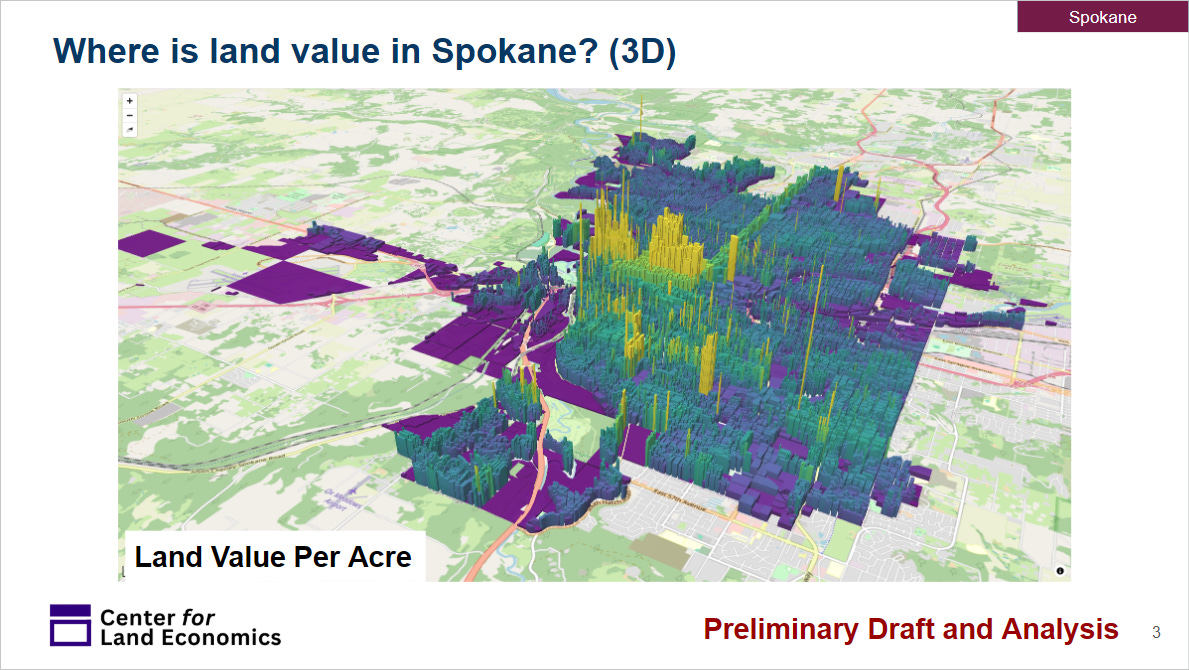
Then, we show where land value is concentrated overall:
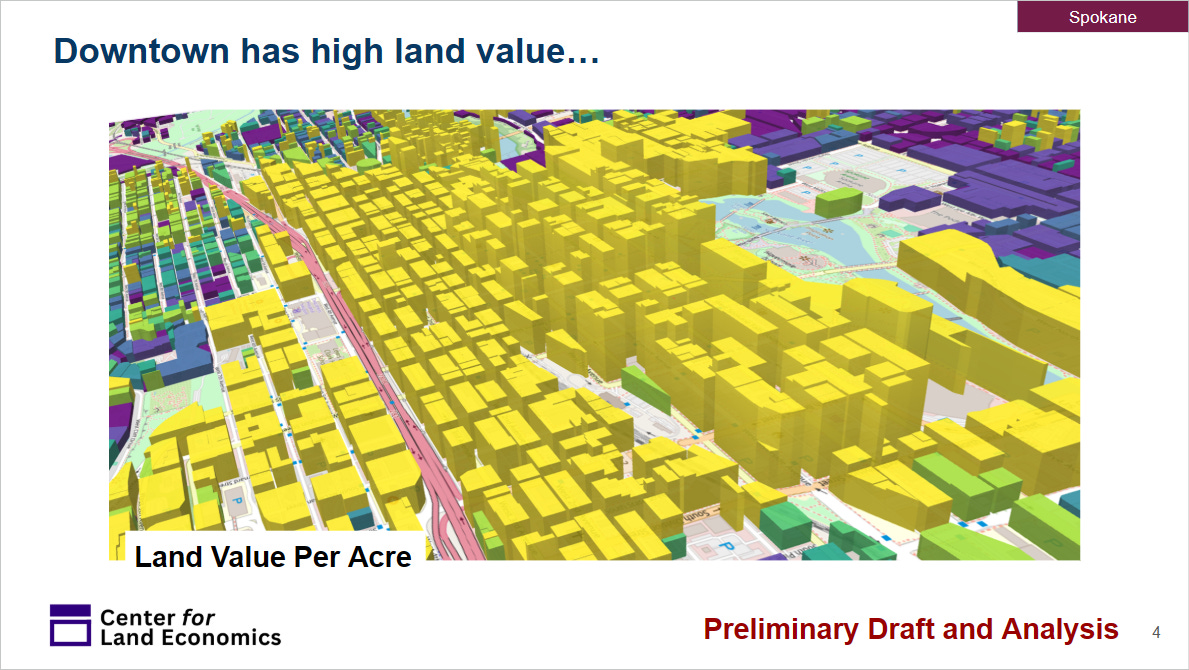
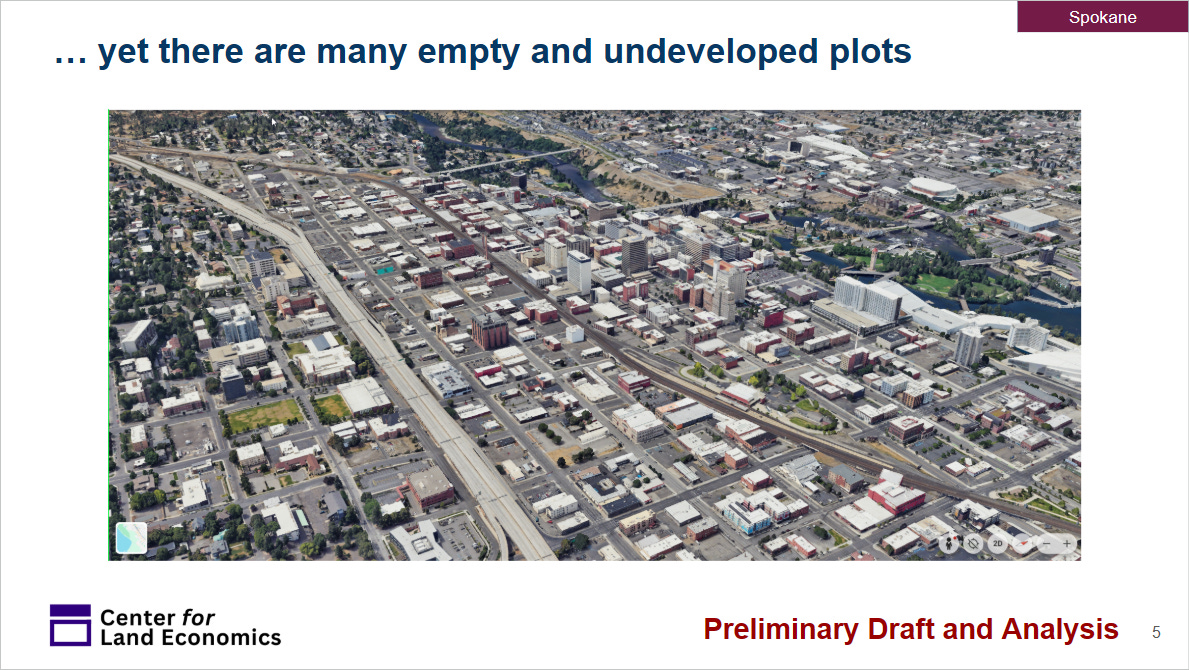
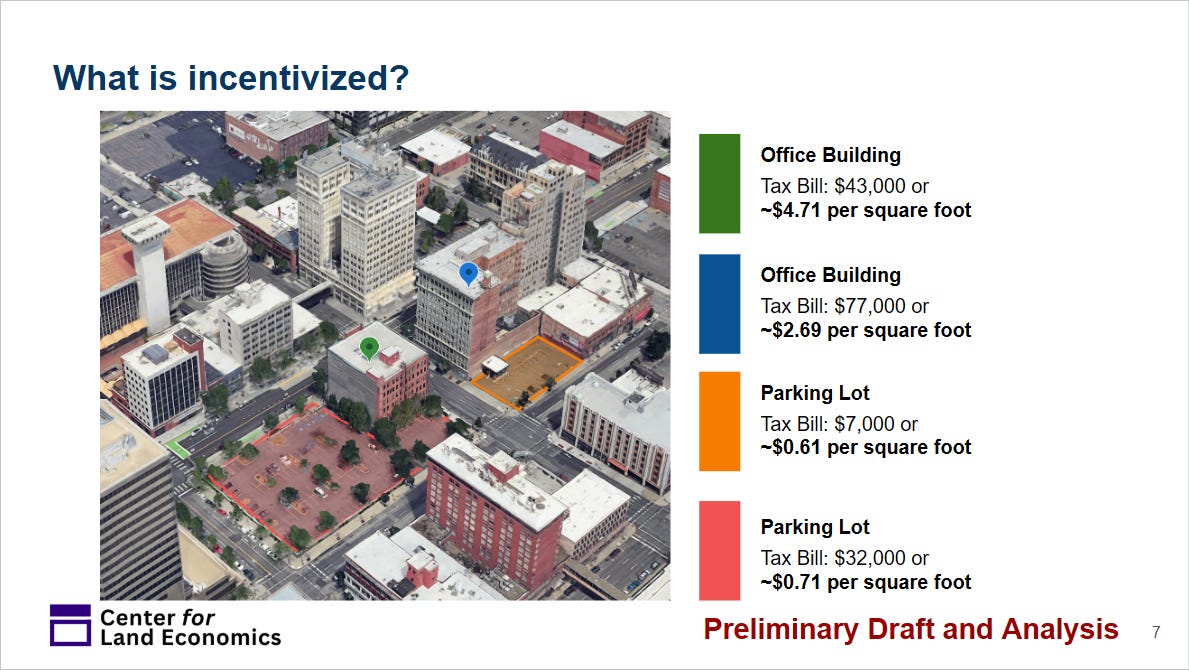
…followed by a pair of slides that show how the most valuable area of town is being utilized far below its potential. We point out that taxing buildings discourages developing downtown to its full potential, while under-taxing downtown’s tremendous land value implicitly shifts property taxes onto everybody else in the city.
We then move to concrete, common-sense examples of how the current property tax system punishes building and investment, and rewards speculation:
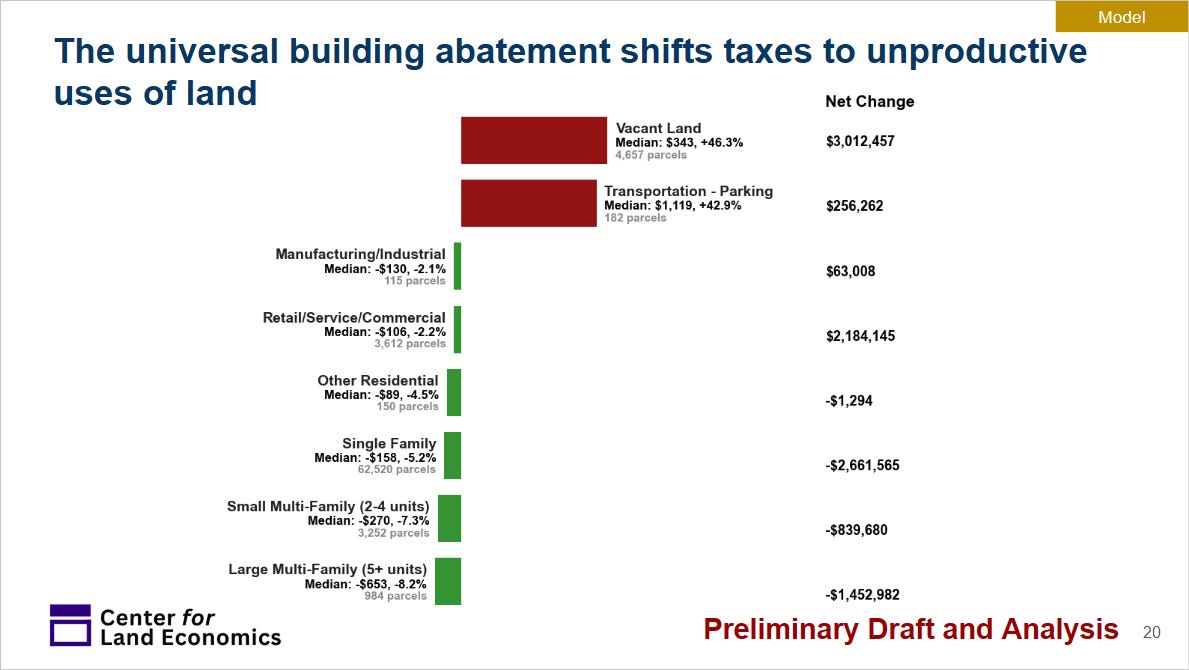
We spend some time going over the mechanics of the policy, and towards the end we go over who wins and who loses:
The report also spends some time going over the proposed policy and explaining it’s mechanics, but you get the basic idea. Take the raw data, and use it to tell common-sense stories about real things happening in the real world, tied directly back to problems your local elected official already cares about.
So how do you get to this point? First, you’ll have to complete a lot of smaller quests, starting with gaining a solid understanding of your local laws.
Legal Analysis
There’s no use in spending hours on a detailed policy plan only to find out that a massive legal barrier you haven’t considered stands in your way. This is especially so if a clearer understanding of the law from the outset would have led you to an alternate policy that wasn’t blocked, while achieving the same goals.
There are five big things you need to know about the law. Create a document for yourself, and put these bullet points on it as headings. Your quest is to fill out all five sections with whatever you can learn about your jurisdiction.
- ⚖ Uniformity
- 📁 Classification
- 📊 Assessment rates
- 🚫 Exemptions
- 📈 Millage rates
⚖ Uniformity
This is whatever state constitutional clause or state law governs whether all real property must be taxed in the same way. Uniformity clauses require that all classes of real property be taxed in a similar manner—that is, you can’t have separate tax rates for different classes of property. These clauses forbid localities from adopting local split-rate taxes. The details matter, however, and in many states the legislature just needs to pass an “enabling act” to circumvent the state constitutional clause rather than requiring a full constitutional amendment; see Uniformity Does not Preclude Land Value Taxes.
Your questions are:
“Does my state have a uniformity clause? If so, where/what is it?”
“Can different types of property be taxed at different rates?”
“Does changing this require an enabling law, or a constitutional amendment?”
📁 Classification
Every state groups different kinds of property into different classes, such as “residential” or “commercial.” Sometimes classifications are defined by local authorities, sometimes they’re defined by state law, and sometimes they’re enshrined in the constitution itself. Even if there is only one uniform tax rate, that tax rate only applies to a property’s taxable value, and some property classes (agricultural land in particular) can have special rules that reduce their taxable value below their fair market value.
Your questions are:
“What are the classifications?”
“Who decides on them?”
“How are they defined?”
“Can land and buildings be treated as different classes?”
📊 Assessment Rates
The assessed value of a property is the amount that is actually used to calculate the final tax bill (sometimes this is the first step in calculating a separate taxable value, and sometimes assessed value is synonymous with taxable value). Typically, this is calculated by multiplying the full market value of a property by an assessment rate, which may or may not differ for each class of property.
Example: the fair market value of a property is $250,000, but the assessment rate is 50%, so the assessed value is $125,000.
Your questions are:
“Who sets the assessment rates?”
“Can land and buildings have different assessment rates?”
“Are there any caps or other limits on assessment rates?”
🚫Exemptions
Real property can be either partially or fully exempt from taxation, and you will most often see this with regards to religious, charitable, or government properties. However, nearly every tax code I’ve looked at has a whole bunch of other exemptions in there as well, and this may provide you with the legal infrastructure you need to pursue the Universal Building Exemption approach. Property tax exemptions can come in three basic forms:
- per owner (e.g. for homeowners, seniors, or veterans)
- per property (e.g. agricultural exemptions)
- per area (e.g. special tax districts)
Your question is:
“Can buildings be partly or fully exempted from taxation?”
📈 Millage Rates
Millage rates represent the actual tax rate—the number that is multiplied against the taxable value, resulting in the parcel’s actual tax bill. As for the term “millage” itself, it’s basically the same as a percentage rate, it’s just expressed in parts per thousand rather then parts per hundred—100 mills is equivalent to 10 percent. Another way to think of it is “for every $1,000 of taxable value, how many dollars of property tax are owed?” Typically, each local government unit whose jurisdiction you are in, will apply their own millage rate against your parcel’s taxable value.
Example: a property with a taxable value of $100,000 is assessed at 15 mills, resulting in $1,500 of taxes owed. In this example, those 15 mills are a combined rate, consisting of 7 mills for the school district, 5 mills for the city, and 3 mills for the county. $700 goes to the school district, $500 to the city, and $300 to the county.
Note: millage rates are usually derived by working backwards from the budget. So if a city has a property tax base whose total taxable value is $1 billion, and the budget they want is $10 million, then the millage rate is 10, or 1%.
Your questions are:
“Who sets the millage rates?”
“What limits are there on millage rates?”
Once you’ve collected the answers to all these legal questions, you should be ready to pick your overall strategy.
Overall strategy
We know what winning looks like abstractly—“reduce taxes on labor and capital and increase taxes on land.” However, there’s more than one way to do that, and which strategy you take depends highly on local conditions. Four basic strategies are:
- Split-Rate Property Tax
Tax land and buildings at different rates. Lower the tax rate on buildings, and raise the tax rate on land. - Universal Building Exemption
Exempt all buildings from taxation. Raise the tax rate (on land). - Land LeasesInstead of selling publicly owned land out of land banks for pennies on the dollar, the public retains ownership of that land and leases it out at market rates, regularly updating the ground rent. This achieves the same goals as LVT for publicly owned parcels.
- Targeted Land Value CaptureApply any of the above strategies, but limited to specially targeted areas, such as special tax districts created around transit stations.
If a uniformity clause blocks the split-rate approach, it might still be constitutional to try for a universal building exemption instead. That’s because even if differential tax rates aren’t allowed, every state provides for property tax exemptions, and you might be able to use the existing legal infrastructure that governs exemptions to your advantage.
All of this requires carefully parsing legal language, and our “official advice” is that at some point you should try to talk to an actual lawyer. That said, lawyers are expensive and you probably don’t have access to one right now. Just personally, I think more people should get comfortable reading the law for themselves and not getting intimidated by legalese. I’ve also found that LLM chatbots are surprisingly adept at parsing these documents into plain English. Just be sure to find someone with actual legal credentials once the stakes get higher.
On that note, if you have professional legal expertise, you could immediately help the movement in one of two main ways. First, by volunteering to make yourself available to local activists, and two, by helping us build up a national database of all the specific legal barriers to Land Value Return throughout the US. If this is you, reach out to us at the Center for Land Economics.
Once you’ve done your legal homework and decided on your basic path, your next step is to crunch some numbers.
Data Modeling
Here’s some more homework for you:
- 🔍 Check local assessed values
- 🗺 Put them on a map
- 💻 Model an LVT shift
The main questions you are trying to answer here are:
“Where is land value concentrated in my jurisdiction?”
“Are the existing land values good enough, or do we need to adopt new ones?”
“Who wins and who loses in my proposed shift?”
“What does my local assessor think of all this?”
Three quick notes here:
First, it’s always easier to proceed with existing land values, than to require a revaluation or the adoption of new land values, particularly ones calculated by an external consultant. Fortunately, in many parts of the country (particularly those with short revaluation cycles), assessors are quite experienced and the land values may already be good enough. If not, you’ll have to convince your jurisdiction to not only adopt a new tax policy, but also to adopt new valuation methods, which is a bigger ask.
Second, the assessor possesses a pocket veto on any property tax shift policy, because not only will lawmakers defer to their expertise, assessors are the ones who must implement much of the policy. Do not make an enemy of them. Include them early in any political discussions with elected officials, anticipate their objections and have ready answers for them. Assessors are used to being treated like the bad guys, so win their trust by treating them with respect.
Finally, you don’t need to have elite data science skills to make good use of public data, and you certainly don’t have to build a bespoke from-scratch valuation model for your entire city. Often the most important thing is to just look at the existing data and tell the stories of existing property taxes.
On to our data modeling homework:
🔍 Check local assessed values
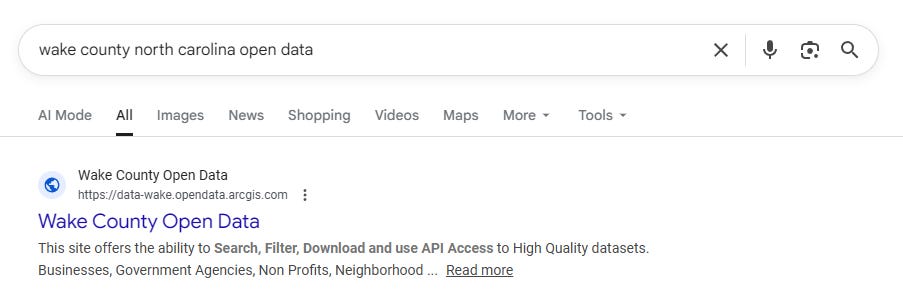
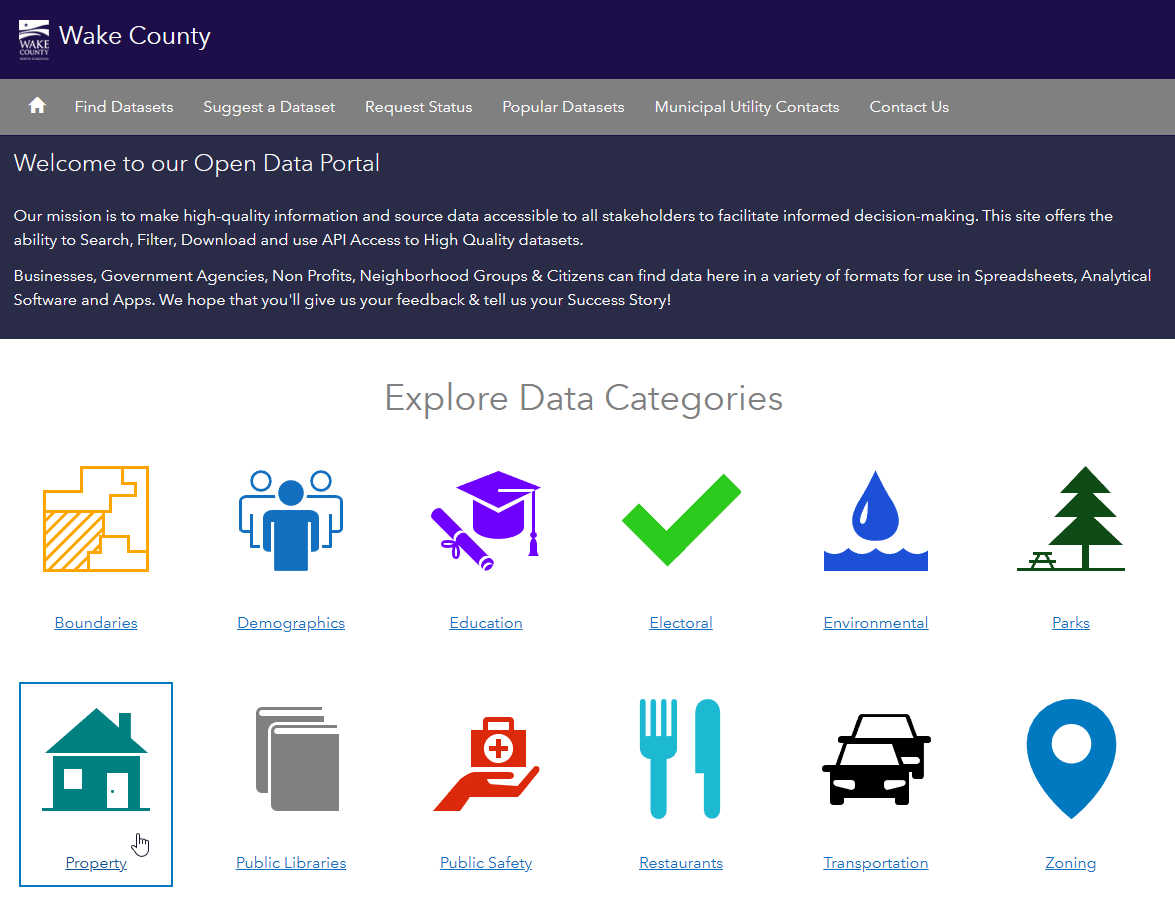
You have two main ways of getting assessed values: download them from an open data portal, or write to your assessor and ask for them. Most cities and counties in the USA have open data portals, which should be your first stop: go to your search engine of choice and search for “<jurisdiction name> open data.” Often the first result will look like this:
The design and contents of your local open data portal will vary wildly, but a lot of them will look something like this, with either a search bar up top or a big friendly landing page. Your mission is to find the property tax parcel data.
A full tutorial on how to navigate open data portals is beyond the scope of this particular essay, but we might cover it in a future article. If at any point you find yourself intimidated by the technical aspect, consider joining the OpenAVMKit discord; plenty of like-minded and highly technically proficient people are gathered there (including myself) and we’ll be happy to guide you.
In any case, you are looking for the following things:
- Parcel shapefile
This is a file that gives you the polygonal geometry of every parcel, along with its primary parcel key identifier, and optionally other useful facts like the size of the land, the situs address, and the owner’s name and mailing address. You need this data in order to put anything on a map. - Assessed values
These are valuations that the assessor has assigned to each real estate parcel. You should expect to find full market values/appraised values, which represents what the property would actually likely sell for, the taxable/assessed values, which is what tax bills are actually based on, along with splits within those categories for land value, improvement value, and total value. You need this data in order to judge whether there are any quality issues with the assessed values, and in order to run any tax shift analysis. - Property characteristics
These may be included in the parcel shapefile, or they may come separately as their own file. They are usually encoded as a data table or spreadsheet of individual facts about land and buildings. Each row should include a primary parcel key identifier that ties these records back to the parcel shapefile. Besides property type, classification, and zoning, the most important of these characteristics are the “big five,” which are the ones most strongly associated with value: land size, building size, building age, building quality of construction/materials, and building physical condition. Additional characteristics include bedrooms, bathrooms, and whatever other data the assessor has chosen to provide. You need this data if you intend to categorize properties by their characteristics, or do any mass appraisal modeling. - Sales transactions
This is a record of recent sales transactions, that is, sale prices, dates, and conditions of the sale. You need this data if you intend to perform independent ratio studies, or if you wish to do your own mass appraisal modeling using tools like our own open source library, OpenAVMKit.
The best assessors might already have done a lot of analysis for you and already posted it on their website. For instance, North Carolina jurisdictions are required to post an annual Schedule of Values, such as this one by Wake County. These kinds of documents describe the local valuation process in detail and is essential reading for any property tax reformer.
As for evaluating the quality of your local jurisdiction’s assessments, you should first see if there’s a state oversight body that has already published results, such as the Texas Comptroller’s annual and comprehensive Property Value Study. The name of the oversight body will vary wildly from state to state, but the most common name is the “Department of Revenue.” Also, oversight results may not be published on your local jurisdiction’s open data portal, they’re more likely to be found on the official website of whatever state agency does the oversight.
In the case that no open data portal is available, your local assessor should at least have a website with contact information. There will likely be instructions for how to make data requests, and if not, you can always just email (or call) them politely and ask. Keywords to use are “parcel export,” or “CAMA export.” They’ll almost certainly ask what you intend to do with the data, so have a clear and concise answer ready.
Alright, you’ve found and downloaded all this data. The first thing you should do is put it on a map and look at it.
🗺 Put it on a map
If the data is already natively in map form (such as an interactive web map), that’s great! If not, you have three main options: Felt.com, CivicMapper / PutItOnAMap.com, and QGIS.
Felt, or as I like to call it, “Google Docs for Maps” is probably the simplest and easiest way to throw together a map.
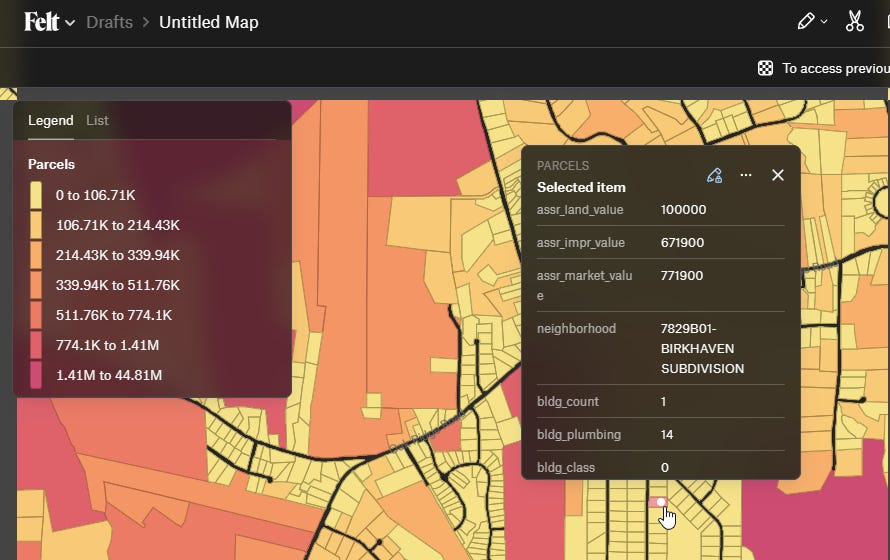
Felt has a free version and a paid version, and comes highly recommended. Felt’s chief advantage is that it’s easy to use, powerful, and it’s dead simple to generate sharable links to maps you create. It’s limited to 2D maps, however.
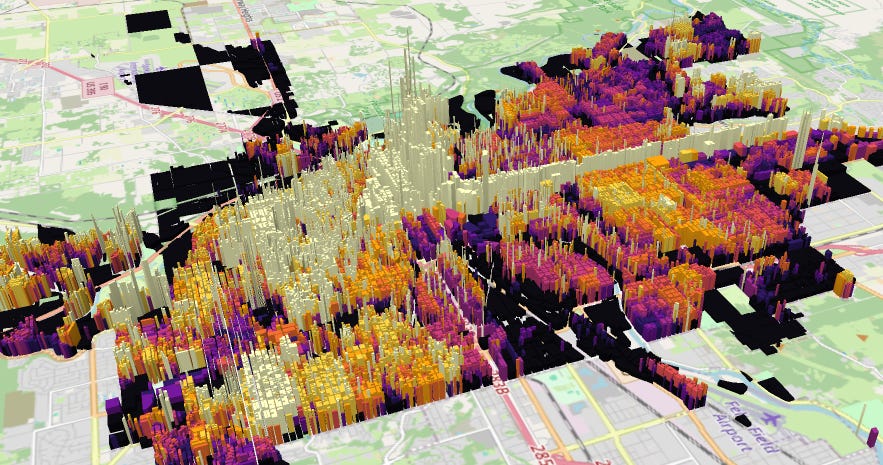
CivicMapper, and its open source version, PutItOnAMap, are tools we created and published here at the Center for Land Economics in order to visualize property and land values in 3D:
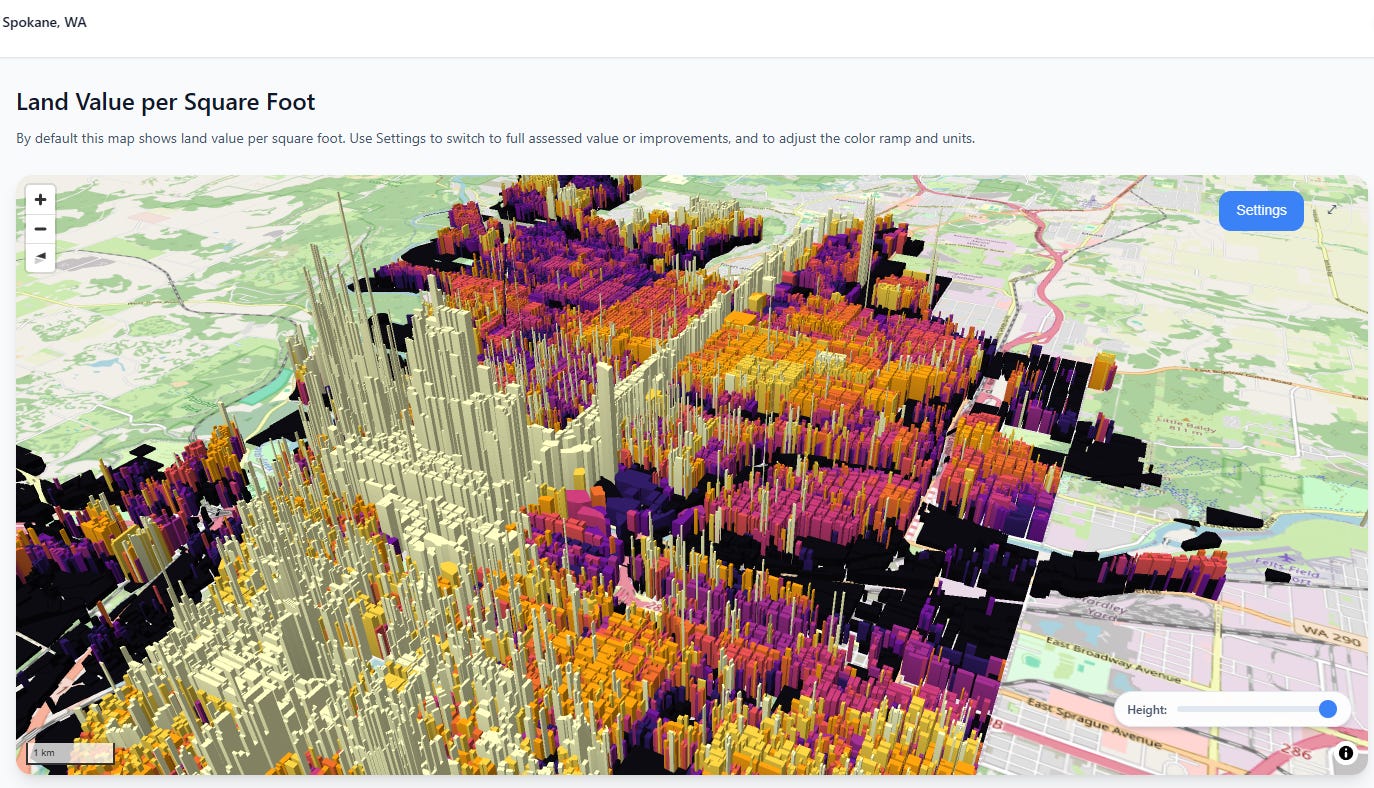
CivicMapper contains a number of curated city datasets that we host ourselves. However, if you want to load your own custom data, you can create a very similar visualization yourself by using PutItOnAMap; you will just have to provide your own data in GeoParquet format.
CivicMapper’s chief advantage is that if your city is already curated by us, you don’t have to do anything, and you can easily share it with others. If you’re using PutItOnAMap, everything runs locally on your own computer and there’s no way to share what you’ve created; in order to show the work to someone else you’ll have to either create screenshots, or show them your laptop screen. We’re actively working on both sites and welcome feedback and feature requests.
As a final alternative, you can always use professional-grade GIS software, like the free and open source QGIS. These kinds of tools are very powerful, but also have a steep learning curve.
Okay, so you’ve got your stuff on a map. What are you looking for?
Look for inconsistent land values
Take a look at land values for neighboring side-by-side parcels, particularly in terms of $/sqft or $/acre, and look for discrepancies. In theory, parcels in the same location, with the same characteristics (size, shape, land use/zoning, utility access, etc.) should have similar land valuations. If they don’t, and there’s no good explanation for why they should differ, it could be a sign of anomalies in the land valuation methodology. For an idea of what to look for, see our report on Baltimore’s vacant land valuation.
Frame the big picture
Try to get an intuitive sense of where land value is concentrated and ask yourself if it makes sense. This is also where you can grab a “money shot” for your presentation that captures where land value is concentrated in a city. For instance, this map of Spokane shows how much land value is concentrated downtown, as well as along commercial corridors:
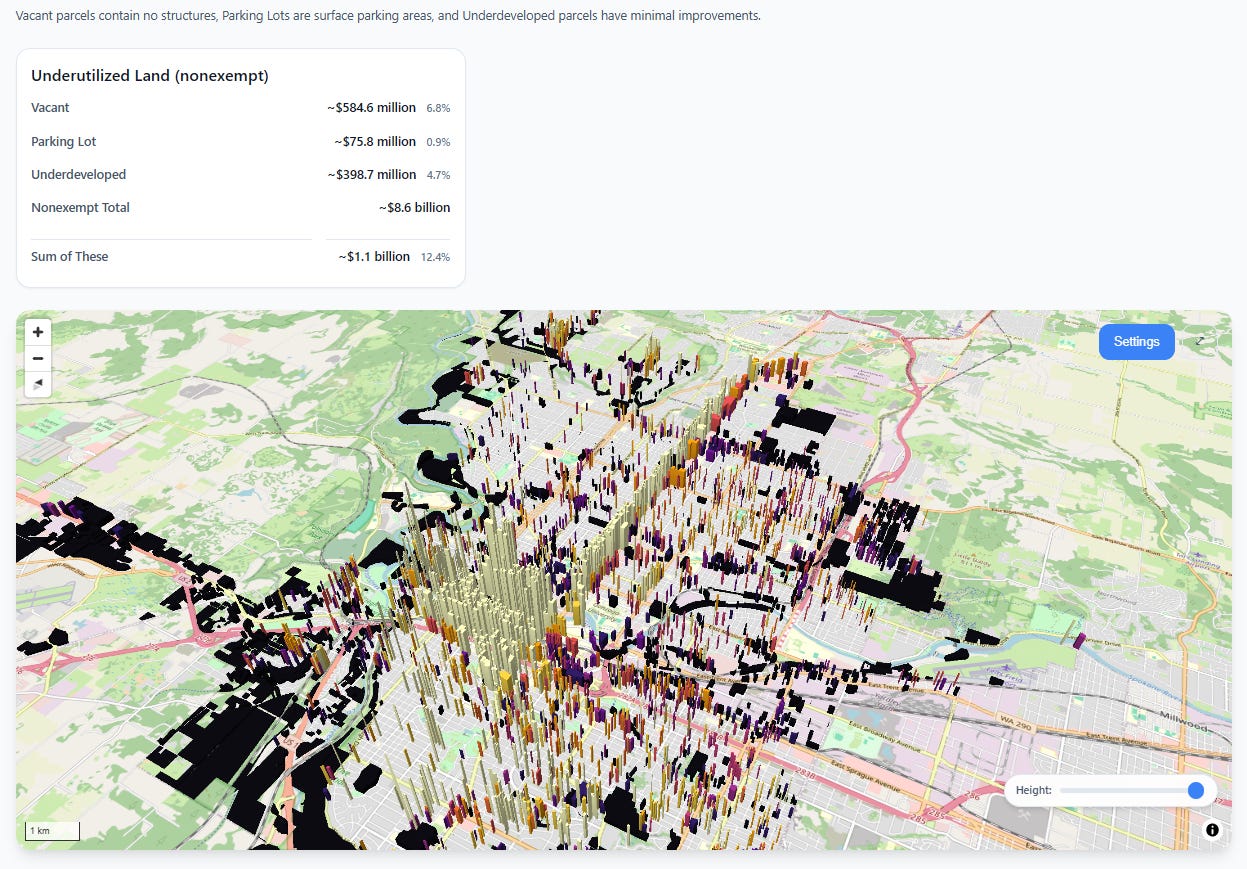
Identify valuable parcels with low value uses
Our curated datasets in Civic mapper include sections for each city where we identify vacant lots, parking lots, and underdeveloped lots, and then show only their land value, to point out how much potential is currently being wasted. If your city isn’t in Civic mapper yet, see if you can recreate these kind of visuals in your own chosen tools. Sum up the total value of these high-value, underutilized parcels.
There’s a lot more you can do with maps, these are just a few things you can do that we’ve found to be particularly effective in crafting our pitch.
💻 Model an LVT shift
This is the part where you actually crunch the numbers and model your actual policy proposal. You’ll want to have a good idea of which approach is the most likely to be legally feasible, and then sit down and do the math. It’s possible to do this entirely in Excel, but we also have our own open source python library called LVTShift if you want to use code—you can read about that here.
At a high level, the modeling process looks like this:
- Get a data table of every parcel in your jurisdiction
- Ensure each row has land value, improvement value, and current taxable value
- Using existing millage rate(s), calculate current taxes owed per parcel under existing law
- Sum up total current taxes owed
- Solve for the new tax rate(s) under a revenue-neutral shift:
- Building exemption strategy:
- Calculate “taxable improvement value” by reducing building value by your reduction formula (complete exemption, partial % exemption, flat exemption, mix of these, etc.)
- Add land value and taxable improvement value from above to get “new taxable value”
- Solve for X, where X is the new millage rate that when multiplied by the new taxable value, equals total current taxes owed.
- Split-rate strategy:
- Determine how much higher the land tax rate will be than the improvement tax rate. Call that ratio R. (Example: land taxed at 4x the rate of buildings means R = 4).
- Solve for X, where land millage rate is X and building millage rate is X/R, such that X * (taxable land value) and X/R * (taxable building value), equals total current taxes owed.
- Building exemption strategy:
This can get pretty complicated in jurisdictions when accounting for multiple stacked millage rates, exemptions, etc., so don’t feel shy about asking for help. For a simple model, keep existing exemptions in place, and handle them by first applying as much exemption amount as possible to the improvement value first, and only then applying any leftover amount to the land.
Wow, that sounds like a lot
Nobody said the quest would be easy, but this is a loose sketch of everything that goes into a typical local campaign. There’s a ton of details I’m leaving out and I’m sure people will have lots of questions, but the point is to just get the basics down so that we can have a standard piece to link to whenever our local advocates ask us, “what can I do?”
Again, you do not have to do everything, and you don’t have to do it by yourself. In fact, if you want to know the least you can do, here’s a nice simple answer.
Hand out a policy brief
Politicians have questions, and those questions need answers. Clear, direct, to-the-point answers. Answers that they can share with their colleagues when you’re not in the room. An essential tool in your kit is the policy brief, a short paper that explains why your policy is a great idea and why anyone should support it.
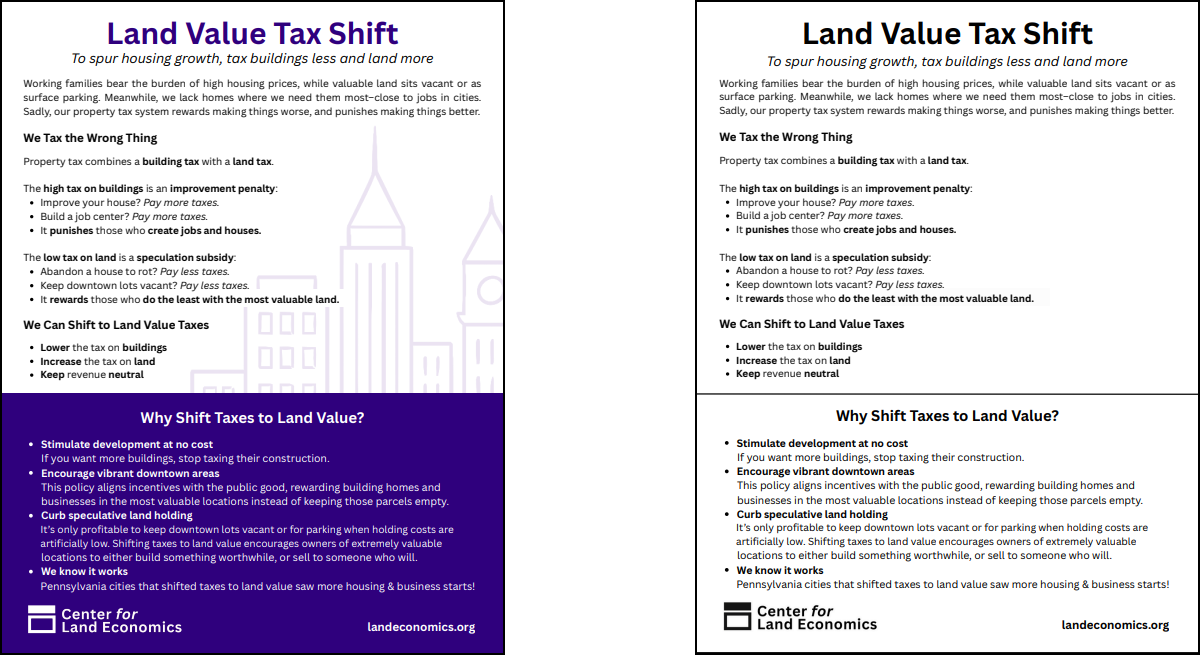
The simplest possible version of this is the “one-pager,” which you will almost certainly be asked for at some point. We’ve taken the liberty of putting one together for you, which you can find on our LVT resources page:
We’ll try to build out more materials in the coming year, but sometimes you’ll find you need to produce something yourself. Not everything can fit on a single page, but a good brief doesn’t have to be super long and fancy, either. It just has to do three things:
- Explain what the policy is
- Show why it’s a good idea and why it will work
- Be short and to the point
Start local, Start small
You don’t have to do it all at once, you don’t have to do it all yourself, and you don’t have to do it everywhere. Figure out what you can do now, what you can’t do but could do if you had more skills/knowledge, and what you need someone else’s help for. Over time you will be able to close those gaps. Post about what you’re doing somewhere others can see it, and make yourself known to others in the movement.
Thanks for joining us. We couldn’t do this without you.
And don’t forget to reach out!
When the full report is officially published, we’ll write an article that describes how we craft these pitches in detail, and turn it into a template you can follow yourself