Rising land values and housing costs drive poverty
Housing costs now determine who counts as poor in America — renters' supplemental poverty rate is 23.9% vs 5.7% for mortgaged owners — while rents have outrun renter incomes 21% to 2% since 2001, and the long-run rise in housing costs is driven by land prices, not construction.
At a glance — Each link — land drives housing costs, and housing costs drive who is poor — is separately well evidenced, but George's full causal chain from land appreciation to poverty is rarely tested end-to-end, so the claim is strong on components and moderate as a whole. Evidence: Moderate (every link in the chain is separately well-evidenced; the end-to-end causal claim — land appreciation causes poverty — is rarely tested as such) · 9 supporting sources · 0 challenging Strongest support: Knoll, Schularick & Steger (2017) — the housing costs squeezing renters are, in the long run, rising land prices rather than building costs. The closest thing to an end-to-end causal test is Fetzer, Sen & Souza (2023; source 14 below): an exogenous rent-subsidy cut in the UK caused measurable increases in evictions, financial distress, and homelessness — testing the housing-cost → hardship link with quasi-experimental methods. No structural counter-evidence is currently wired; see Limits.
The Claim
Rising land values — experienced by ordinary people as rising rents and housing costs — are a first-order driver of poverty in rich economies. This is Henry George's core thesis in Progress and Poverty (1879), modernized: as communities grow richer, the gains are absorbed into the price of location, leaving those who must pay for access to land squeezed between stagnant net incomes and climbing shelter costs.
The three strongest citations:
- U.S. Census Bureau, Supplemental Poverty Measure (2023): when poverty thresholds account for housing costs and tenure, the poverty rate for renters is 23.9 percent versus 5.7 percent for owners with a mortgage — and the SPM rate (12.9%) exceeds the official rate (11.1%) largely because it "accounts for geographic variation in housing expenses."
- Harvard Joint Center for Housing Studies (2024): "Median rents have risen nearly continuously since 2001 in inflation-adjusted terms and are 21 percent higher as of 2022. Meanwhile, renters' incomes have risen just 2 percent during the same period." A record 22.4 million renter households were cost-burdened in 2022; 12.1 million spent over half their income on housing.
- Chetty & Hendren (QJE 2018): neighborhoods causally shape children's adult earnings — outcomes of children who move to better areas "improve linearly in proportion to the amount of time they spend growing up in that area, at a rate of approximately 4% per year of exposure" — which makes the price of location the price of admission to opportunity itself.
Honest limit, up front: modern economics has studied every component of this claim, but almost never George's causal chain end-to-end; and George's literal 1879 version — that progress deepens absolute want — is contradicted by the long-run decline in measured material poverty. The defensible modern claim is about who captures growth and what shelter costs do to the margins, not about absolute immiseration.
The Evidence
Housing costs are now central to who counts as poor
The Census Bureau's Supplemental Poverty Measure exists in large part because shelter costs dominate low-income budgets. Unlike the official measure, SPM thresholds "[v]ary by family size, composition, and housing tenure with geographic adjustments for differences in housing costs." The result is stark: in 2023 the SPM rate for renters rose 1.7 points to 23.9 percent — the highest of the three tenure groups — against 5.7 percent for owners with a mortgage and 11.5 percent for owners without one. Renters' poverty thresholds rose 8.6 percent in a single year (2022–2023), faster than either owner group's, because their housing costs rose faster. Exposure to the housing market, more than any demographic trait, now sorts Americans across the poverty line.
Rents have outrun renter incomes for a generation
Harvard's Joint Center for Housing Studies documents the squeeze: inflation-adjusted median rent up 21 percent since 2001 against 2 percent for renter incomes; a record 50 percent of renter households cost-burdened in 2022; severe burdens (over half of income on shelter) at an all-time high of 12.1 million households; and a loss of 2.1 million units renting under $600 since 2012. When shelter absorbs 30, 40, or 50 percent of a low income, every other deprivation poverty involves — food, transport, medicine, savings — follows arithmetically.
The JCHS's 2024 update sharpens the picture further: 83 percent of renters earning under $30,000 were cost-burdened in 2023, including 67 percent with severe burdens. The median renter household earning less than $30,000 had just $250 left over each month after paying rent and utilities — a 55 percent decline since 2001, including a 44 percent drop between 2019 and 2023 alone. Severely cost-burdened renters in the bottom expenditure quartile spent 50 percent less on healthcare, 48 percent less on food, and 47 percent less on transportation than their unburdened counterparts. The arithmetic is direct: when rent rises, every other necessity is crowded out.
Housing cost burden is chronic — unlike poverty itself
A 50-year longitudinal study of the Panel Study of Income Dynamics (Colburn & Allen, 2024) reveals a finding that distinguishes housing cost burden from poverty: while roughly 75 percent of poverty spells last less than one year, the average duration of a housing cost burden spell doubled from 1.5 years in the 1970s to over 3 years in the 2010s. Aggregate exposure — the share of a decade spent in cost-burdened status — rose from 15 percent to 30 percent over the same period, and exposure to severe cost burden tripled. The increase in prevalence has been driven by longer spells, greater cumulative exposure, and higher rates of recurrence — not by more households briefly touching the threshold. Disparities are stark: households of color face spells about 6 months longer than white households, and aggregate exposure for households of color reached 34 percent in the 2010s against 22 percent for white households.
This chronicity matters for the claim: if housing cost burden were fleeting — like most poverty spells — it would be a hardship but not a structural driver of deprivation. The finding that it is instead persistent and recurring makes the housing-cost → poverty link more consequential than a cross-sectional snapshot would suggest.
Housing affordability directly harms children — causal evidence
The strongest causal evidence on the housing-cost → deprivation link comes from child outcomes. Newman & Holupka (2015), using both propensity score matching and instrumental variable approaches on PSID data, find that housing affordability problems negatively affect reading and math scores for low-income children, with the worst outcomes at extreme burdens (above 60 percent of income). A companion study (Newman & Holupka, 2014) identifies the mechanism: child enrichment expenditures — books, lessons, activities — have an inverted U-shaped relationship with housing cost burden, with the inflection point at roughly the 30 percent housing cost-to-income ratio. When rent eats first, children's developmental spending is what gets cut.
A 64-study synthesis (Holme, 2022) identifies four pathways through which housing affordability affects children: residential mobility and school disruption, reduced housing and living environment quality, restricted access to high-opportunity neighborhoods and schools, and reduced parental financial resources — the residual-income channel. The synthesis concludes that the residual-income pathway is the strongest: when housing costs leave families with too little for other necessities, children's outcomes suffer across cognitive, behavioral, and health dimensions.
A quasi-experimental test of the housing-cost → hardship link
Fetzer, Sen & Souza (2023) exploit a cut in rent subsidies for low-income UK households in April 2011 — a quasi-exogenous shock to housing affordability — and find it caused significant increases in financial distress, evictions, property crimes, insecure temporary housing, statutory homelessness, and actual rough sleeping. The effects were concentrated among families with children, lone parents, and individuals with pre-existing health conditions. The fiscal savings to the central government were partially offset by increased local council spending to meet statutory homelessness obligations. This is the closest thing in the literature to an end-to-end causal test of the housing-cost → poverty link: an exogenous change in what households pay for shelter produced measurable increases in the most severe forms of deprivation.
The rising cost is land, not buildings
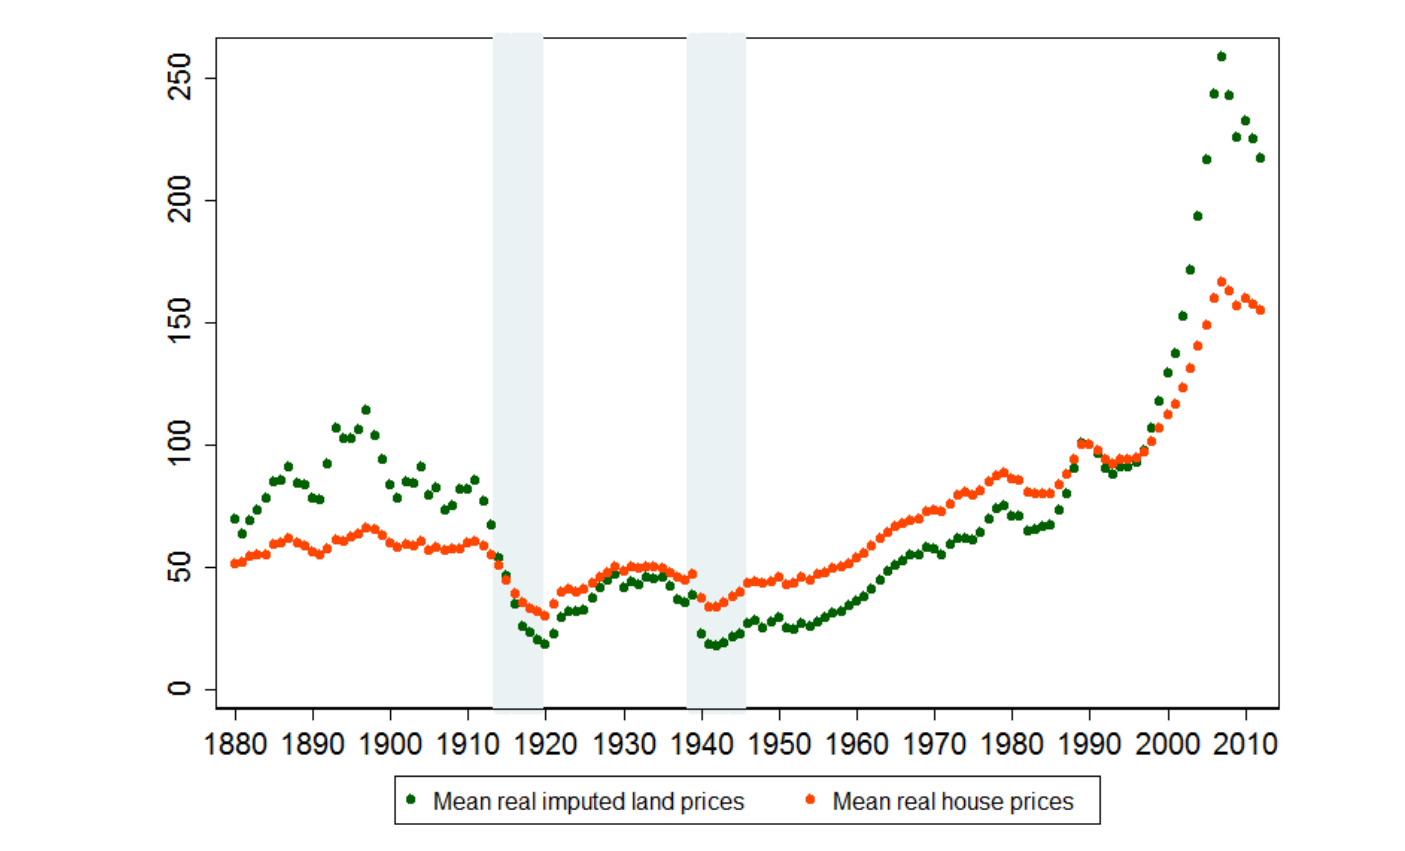
What has actually become expensive is not construction but location. Knoll, Schularick & Steger (2017), building house-price series for 14 advanced economies over 1870–2012, find real house prices roughly flat for eight decades and then sharply rising after 1950 — a rise they attribute mostly to rising land prices, not building costs. Rognlie (2015) shows the celebrated long-run rise in capital's share of income is almost entirely a rise in the housing (effectively land) share. In the U.S. cross-section, Albouy, Ehrlich & Shin (2018) measure urban land worth more than twice GDP, with just five metro areas holding 48 percent of all urban land value. The "housing costs" that drive the poverty statistics above are, at the margin and in the long run, land costs.
The price of location is the price of opportunity
Albouy (2016) shows that city-level productivity and amenities capitalize into land rents: the places where wages and opportunities are highest are precisely the places where land eats the difference. Chetty & Hendren's quasi-experimental work on seven million moving families shows why this matters for poverty: growing up in a better neighborhood causally raises adult earnings at roughly 4 percent per year of childhood exposure. Where access to high-opportunity places is rationed by housing costs, land prices do not merely reflect inequality — as analysis, they help transmit it, by pricing poor children out of the neighborhoods that would have raised their lifetime incomes. (Chetty and Hendren themselves study neighborhoods, not land prices; this last step is interpretive.)
The extreme margin: homelessness
The sharpest edge of the claim is the best-documented: across U.S. cities, homelessness rates track rents and vacancy rates — not local rates of poverty, mental illness, or drug use — and a federal GAO panel study associates a $100 rise in median rent with roughly a 9 percent rise in homelessness. See Homelessness is a housing-cost problem and Colburn & Aldern (2022).
George's original claim
Progress and Poverty argued that material progress raises land rents faster than wages, so that the gains of civilization accrue to landowners while labor's position fails to improve — "the increase of want with the increase of wealth." Book IV ("Effect of Material Progress upon the Distribution of Wealth") spells out why, identifying three distinct mechanisms rather than relying on Ricardo's extension of cultivation to inferior land alone:
- Population growth raises rent even without exhausting better land. Book IV, ch. II argues that increasing population raises the productive capacity of land already in use — through cooperation, exchange, and the emergence of a market center — independent of any need to farm worse soil. George's illustration: a lone settler on virgin prairie is land-rich but labor-poor; as neighbors arrive, the same acre's usefulness rises from farmland to town-lot to city-center, and its owner, "like another Rip Van Winkle, he may have lain down and slept; still he is rich — not from anything he has done, but from the increase of population" (Book IV, ch. II). George calls this — "bringing out in land special capabilities otherwise latent" — probably "the more important" of the two channels by which population raises rent, ahead of the classical extensive margin.
- Labor-saving invention raises rent on its own, without any population growth. Book IV, ch. III argues that because human wants are not fixed, every efficiency gain from new machinery or methods is spent on producing more wealth rather than banked as leisure, which extends demand for land and forces the margin of production down — so "every improvement or invention... which gives to labor the power of producing more wealth... has a tendency to increase rent," and "as we can assign no limits to the progress of invention, neither can we assign any limits to the increase of rent, short of the whole produce" (Book IV, ch. III).
- Speculation forces the margin outward faster than production requires. Book IV, ch. IV argues that the "confident expectation of the future enhancement of land values" leads owners to withhold land in hope of a higher price, artificially pushing the margin of cultivation beyond what current needs require — the theoretical account behind vacant city lots "in the midst of costly buildings" and settlers who must "pass for long distances through half-tilled farms" before reaching land actually free of rent (Book IV, ch. IV). See Land Speculation for the fuller treatment, including George's claim (Book V, ch. I, outside this page's scope) that this speculative overshoot is the primary cause of industrial depressions.
Before Book IV's mechanisms, George had already argued the same thesis empirically in Book V, ch. II ("The Persistence of Poverty Amid Advancing Wealth"), citing the best historical wage-and-rent data available to him: "The rent of agricultural land in England is now, according to Professor Rogers, 120 times as great, measured in money, as it was 500 years ago, and 14 times as great, measured in wheat," while "according to the estimate of Professor Fawcett, the capitalized rental value of the land of England now amounts to £4,500,000,000" — a sum George notes exceeded, by his own calculation, twice the value the whole population of England would have carried at 1860 Southern-US slave prices had they been enslaved (Book V, ch. II). The Rogers series is drawn from James E. Thorold Rogers' History of Agriculture and Prices in England (the standard 19th-century compilation of English price and wage history back to the 13th century); Henry Fawcett's capitalized-rent estimate appears in his own Manual of Political Economy. George pairs the long-run series with a shorter-run test he thought equally telling: citing Malthus's own (non-Georgist) observation that a day's common labor bought half a bushel of wheat under Henry VII but only a third as much under Elizabeth I, and Hugh Latimer's 1549 sermon testimony that a farm his father held near-rent-free at three or four pounds a year later let for sixteen pounds — evidence, in George's reading, of the same rent-absorbs-the-gain dynamic operating well before industrialization (Book V, ch. II). These period estimates are George's own citations of contemporaries' scholarship, not this wiki's independent verification of Rogers' or Fawcett's figures, and should be read as historical illustration of George's argument rather than as modern-standard evidence; the page's Moderate rating and its "components, not end-to-end" caveat above apply to this material too.
The chapter-VIII summary of Book III states the resulting distributional law in George's own words: "Rent swallows up the whole gain and pauperism accompanies progress" (Book III, ch. VIII). The modern evidence above vindicates George's mechanism — growth does capitalize into land values (Albouy 2016), land does absorb a rising share of income (Rognlie, Knoll et al.), and shelter costs do define modern poverty (Census SPM) — while his strongest prediction, absolute immiseration, has not held (see below). Notably, none of the three Book IV mechanisms depends on Malthusian population pressure or on Ricardo's inferior-land extension alone; modern land-price evidence (post-1950 acceleration despite no shortage of farmland) sits more comfortably with George's invention- and speculation-driven channels than with the classical extensive-margin story.
Has George's causal claim been tested as such?
Not end-to-end — but the housing-cost → hardship link now has quasi-experimental evidence. The components are each well-studied: housing costs' role in poverty measurement (Census/BLS SPM literature), rent burdens (JCHS and a large housing literature), land's role in housing costs (Knoll–Schularick–Steger; Albouy–Ehrlich–Shin), land's absorption of growth (Albouy; Rognlie), and place effects on mobility (Chetty–Hendren). The housing-cost → hardship link — the second half of George's chain — now has a quasi-experimental test: Fetzer, Sen & Souza (2023) show that an exogenous rent-subsidy cut in the UK caused measurable increases in evictions, financial distress, and homelessness. What remains untested is the full chain from land appreciation through rents to poverty transitions — a design tracing exogenous land-value shocks into poverty outcomes. The chain here is assembled from separately evidenced links, which is why this page is graded Moderate rather than Strong despite the strength of its parts. Constructing a full end-to-end test is an open research problem; until one exists, the composite claim should be attributed ("Georgists argue, and component evidence suggests…"), not stated as an established empirical finding.
Causal mechanism evidence comes from Hornbeck & Moretti: local productivity growth raises housing costs enough that renters' "increased earnings are largely offset by increased cost of living" — the land-cost channel operating on measured incomes, with the honest caveat that their national bottom line puts overall incidence mainly on workers once mobility is counted.
Counter-Evidence and Limits
- Absolute poverty has fallen while land values rose. The official U.S. poverty rate was 11.1 percent in 2023 — roughly half the level at the series' start in 1959 (Census P60-283, Figure 1) — over decades in which land values climbed steeply. George's literal claim that progress deepens want is not supported; the defensible claim is that land absorbs a large share of progress and that housing costs are now the binding constraint at the bottom, not that material conditions have worsened overall.
- High housing costs partly reflect compensation, not just extraction. In spatial-equilibrium models — including Albouy's own — expensive places pay higher wages and offer better amenities; some of the cost difference is the price of real advantages received. Adjusting poverty thresholds for local housing costs (as the SPM does) is itself debated for this reason: a high-rent city is not purely a tax on its residents.
- The proximate policy culprit may be regulation, not land speculation. A major strand of urban economics (Glaeser & Gyourko) attributes high housing costs in coastal metros primarily to supply restrictions — zoning and land-use regulation — rather than to landownership per se. Georgists respond that regulation is one of the ways location rents are created and defended, but the distinction matters for remedies: upzoning and land value taxation are different prescriptions.
- Correlation and composition problems. Renters are poorer than owners for many reasons besides rent levels; the SPM tenure gap partly reflects selection into renting. The JCHS burden figures describe a squeeze but do not by themselves identify land appreciation as its cause.
- Mobility is a partial escape valve. Households can and do relocate toward cheaper land, blunting the poverty effect of any one market's appreciation — though the Chetty–Hendren evidence implies the cost of that escape is paid in foregone opportunity for children.
Further corroboration. Stiglitz (2015) argues the modern rise in the wealth-income ratio and in wealth inequality is largely a land-value phenomenon, tying rising land prices to the distribution of income. La Cava shows the postwar rise in the US housing income share is imputed rent concentrated in supply-constrained states, and Bonnet et al. confirm the rising wealth-to-income ratio is land-driven rather than a rise in productive capital.
See Also
- The Problems — the full index of diagnosis claims
- Outcome: Homelessness is a housing-cost problem
- Narrative: The Housing Crisis Is a Land Crisis
- Law of Rent · Economic Rent · Unearned Increment
- Outcome: LVT improves housing affordability
Sources
- U.S. Census Bureau, Poverty in the United States: 2023, Current Population Reports P60-283, September 2024. census.gov — used for the SPM design ("geographic variation in housing expenses," tenure-adjusted thresholds), the 12.9%/11.1% SPM-vs-official rates, the 23.9% renter vs 5.7% mortgaged-owner SPM rates, renter-threshold growth, and the 1959–2023 official series. Full PDF fetched and read 2026-07-10.
- Joint Center for Housing Studies of Harvard University, America's Rental Housing 2024, January 2024. jchs.harvard.edu — used for the 22.4M/12.1M cost-burden records, the 50% burdened-renter share, the 21%-vs-2% rents/income divergence since 2001, and the low-rent unit losses. Fetched and read 2026-07-10.
- Raj Chetty & Nathaniel Hendren, "The Impacts of Neighborhoods on Intergenerational Mobility I: Childhood Exposure Effects," Quarterly Journal of Economics 133(3), 2018, 1107–1162. Open PDF: opportunityinsights.org — used for the causal neighborhood-exposure finding (~4% per year of exposure; seven million moving families). Fetched and read 2026-07-10.
- Katharina Knoll, Moritz Schularick & Thomas Steger, "No Price Like Home: Global House Prices, 1870–2012," American Economic Review 107(2), 2017. DOI: 10.1257/aer.20150501 — used for the finding that the post-1950 house-price boom is mostly rising land prices. Wiki research page.
- Matthew Rognlie, "Deciphering the Fall and Rise in the Net Capital Share," Brookings Papers on Economic Activity, Spring 2015. PDF — used for the finding that the long-run rise in the capital share is almost entirely housing/land. Wiki research page.
- David Albouy, "What Are Cities Worth? Land Rents, Local Productivity, and the Total Value of Amenities," Review of Economics and Statistics 98(3), 2016. DOI: 10.1162/REST_a_00550 — used for the capitalization of productivity/amenities into land rents. Wiki research page.
- David Albouy, Gabriel Ehrlich & Minchul Shin, "Metropolitan Land Values," Review of Economics and Statistics 100(3), 2018. DOI: 10.1162/rest_a_00710 — used for the scale and concentration of U.S. urban land value. Wiki research page.
- Henry George, Progress and Poverty (1879, Memorial Ed. 1898), Book III ch. VIII, Book IV chs. II–IV, and Book V ch. II ("The Persistence of Poverty Amid Advancing Wealth") — the original statement of the claim, its three-part mechanism (population raising land's latent capacity; labor-saving invention extending the margin; speculative withholding forcing the margin further), and George's historical wage-rent evidence (Rogers' English rent series, Fawcett's capitalized-rent estimate, Malthus's Henry VII/Elizabeth wage-in-wheat comparison, Latimer's rent testimony); quotations verified verbatim against the repository's hosted full text. Full hosted text; Wiki research page.
- Whitney Airgood-Obrycki, Deteriorating Rental Affordability: An Update on America's Rental Housing 2024, Joint Center for Housing Studies, 2024. jchs.harvard.edu — used for the 83% cost-burden rate among renters under $30K, the $250/month residual income figure, the 55% residual-income decline since 2001, and the spending tradeoffs (50% less on healthcare, 48% less on food). Fetched and read 2026-08-11.
- Gregg Colburn & Ryan Allen, "The dynamics of housing cost burden among renters in the United States," Focus on Poverty 40(1), September 2024. irp.wisc.edu — used for the 50-year PSID findings: cost-burden spell duration doubling (1.5→3 years), aggregate exposure tripling, the contrast with episodic poverty (75% of poverty spells <1 year), and racial disparities in exposure. Fetched and read 2026-08-11.
- Sandra Newman & C. Scott Holupka, "The Effects of Housing Affordability on Child Outcomes," Journal of Policy Analysis and Management, 2015. DOI: 10.1002/pam.21834 — used for the causal finding (propensity score matching + IV) that affordability problems negatively affect children's reading and math, with worst outcomes at >60% burden. Fetched and read 2026-08-11.
- Sandra Newman & C. Scott Holupka, "Housing affordability and investments in children," Journal of Housing Economics 24, 2014. DOI: 10.1016/j.jhe.2014.03.002 — used for the inverted U-shaped relationship between cost burden and child enrichment expenditures, with inflection at ~30% ratio. Fetched and read 2026-08-11.
- Jennifer Jellison Holme, "Growing Up as Rents Rise: How Housing Affordability Impacts Children," Review of Educational Research, 2022. DOI: 10.3102/00346543221079416 — used for the 64-study synthesis identifying four pathways (mobility, living environment, neighborhood opportunity, parental resources) and the primacy of the residual-income channel. Fetched and read 2026-08-11.
- Thiemo Fetzer, Srinjoy Sen & Pedro Souza, "Housing Insecurity and Homelessness: Evidence from the United Kingdom," Journal of the European Economic Association 21(2), 2023, 526–559. DOI: 10.1093/jeurec/jvac063 — used for the quasi-experimental finding that an exogenous rent-subsidy cut caused increases in evictions, financial distress, and homelessness, concentrated among families with children. Fetched and read 2026-08-11.