Corporate profits increasingly reflect economic rents
A converging empirical literature finds US corporate profits have risen far beyond competitive returns — markups, pure-profit shares, and firm-level return dispersion all point to growing economic rents, extending the Georgist rent analysis beyond land.
At a glance — The rise in US corporate profits above competitive returns is real and abnormal across independent methods, but how much of it is genuine economic rent rather than mismeasured returns to intangible investment remains genuinely contested. Evidence: Moderate–strong for the profit rise itself; contested on how much is rent vs. efficiency · 10 supporting sources · 2 challenging Strongest support: De Loecker, Eeckhout & Unger (2020) — average US markups rose from about 21% to 61% over marginal cost between 1980 and 2016. Strongest counter: Crouzet & Eberly (2019) — much measured profit reflects undercounted intangible capital, not rent.
The Claim
An increasing share of corporate profit in the United States (and, more weakly, other developed economies) is economic rent — returns above what is needed to compensate capital and effort in a competitive market — rather than the ordinary reward for investment. This matters for the Georgist framework because it extends the classical rent analysis from land to other non-reproducible positions: market power, network position, regulatory protection, and control of scarce intangibles.
The Evidence
Several independent methodologies converge on the same direction:
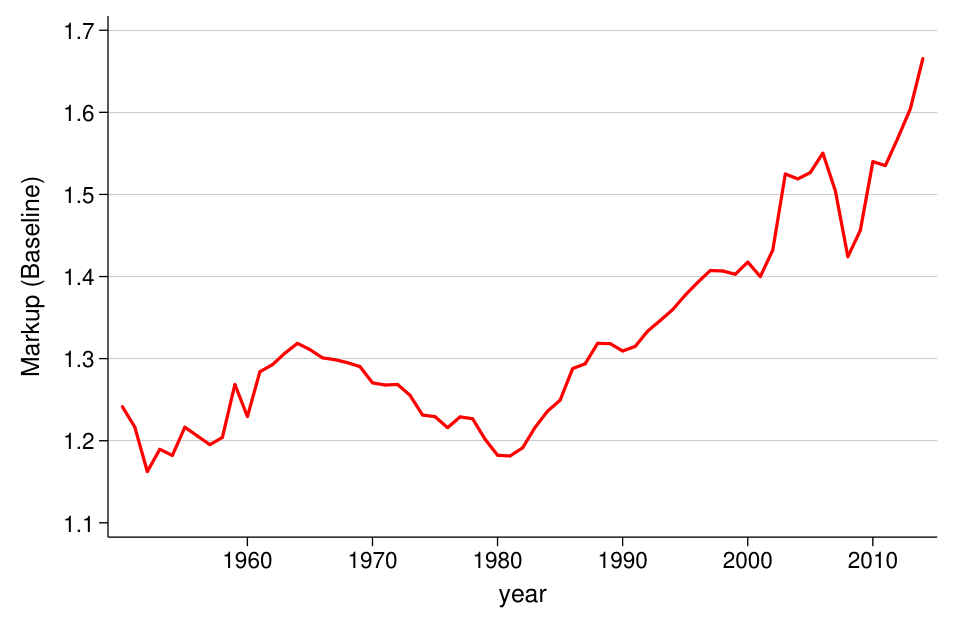
- Markups. De Loecker, Eeckhout & Unger (2020) estimate average US markups rose from about 21% above marginal cost in 1980 to about 61% by 2016, concentrated in the upper tail of firms.
- The pure-profit share. Barkai (2020) finds that both the labor share and the required-return capital share fell over 1984–2014, while the residual profit share rose sharply — a decomposition that isolates returns above the competitive cost of capital.
- Firm-level return dispersion. Furman & Orszag (2015) document that returns on invested capital at the 90th-percentile US firm grew to more than five times the median, with the winners persistent over time — a pattern they read as rents accruing to specific firms rather than rising returns to capital generally.
- Competition and policy. Philippon (2019) argues US markets became measurably less competitive than European ones due to concentration, lobbying, and regulatory barriers — locating the source of the rents in political economy rather than technology alone.
- The synthesis. Eeckhout (2021) draws the markup evidence into a general account of market power raising profits while suppressing wages.
- The structural follow-up. De Loecker, Eeckhout & Mongey (2026), a Minneapolis Fed staff report, fits a general-equilibrium model to 1980–2023 and finds that the output gains from reallocation toward productive firms (about +15%) were more than offset by markup and overhead wedges, for a net loss of about 6% of output; a working paper, not yet peer-reviewed.
- Market-value decomposition. Chiu, Jagannathan, Lin & Tseng (2025) split the market value of US public firms into tangible assets, capitalized intangible investment, and a valuation residual, and find that residual — which they argue is mostly ex-post economic rent — rose from almost nothing in 1976 to 45% of market value ($21 trillion) by 2020, concentrated in large high-tech and healthcare firms with higher markups and lower labor shares. Notably it uses the same intangibles-capitalization method as the counter-case below but separates the ~10% that is capitalized investment from the ~45% residual it reads as rent — though that residual also contains adjustment costs and some mispricing, so it is an upper bound on rent rather than a direct measure.
- Cross-country excess-profit estimates. Hebous, Prihardini & Vernon (2022) measure multinationals' profits above a normal-return allowance in IMF cross-country data — finding them large and heavily concentrated in investment hubs (median ~1.9% of GDP there, versus ~0.01% for the median low-income country), independent corroboration that a meaningful share of recorded corporate profit exceeds any plausible normal return, with the concentration pattern itself evidence of profit shifting rather than local activity.
The Counter-Case
The main rival reading is that measured profits reward genuine efficiency and investment rather than rent:
- Crouzet & Eberly (2019) show that concentration and high measured profits partly reflect intangible capital (software, brands, organizational know-how) that standard accounts undercount — in some sectors the "profit" is a return on real, if hard-to-measure, investment. Their sector-level decomposition finds productivity-driven concentration in consumer sectors, markup-driven concentration in healthcare, and both in high-tech.
- The superstar-firms literature (Autor et al. 2020) similarly attributes rising concentration in part to winner-take-most competition among unusually productive firms — a mechanism in which high profits and consumer benefit can coexist.
These are not fully exculpatory: rents on intangibles and network positions are still returns to scarcity and position rather than to marginal production, which is why parts of this literature (e.g., Mazzucato, Ryan-Collins & Gouzoulis 2023) treat them as the modern frontier of rent analysis. But they mean the size of the pure-rent component is genuinely contested.
A firm-specific counter-case: a 2026 Review of Radical Political Economics paper by Stephen Maher and Scott Aquanno, "Monopoly or competition? Unraveling the Amazon paradox," argues directly against reading Amazon's dominance as monopoly rent extraction — "Amazon does not exhibit the conventional signs of monopoly because it is not a monopoly." The authors propose a classical Marxian theory of "real competition" (rivalry intensified by scale and reinvestment rather than textbook perfect competition) as a more coherent account of Amazon's position than either standard monopoly-power framing or the wiki's own rent lens. This is a different theoretical tradition than the Georgist/mainstream-economics rent analysis this page otherwise draws on, and it is itself contested within its own literature, but it is a legitimate dissenting single-firm case worth flagging: not every large, dominant platform firm is a settled instance of rent extraction, and the Amazon case specifically remains argued both ways.
A separate, short-run caution: Bank of Canada staff analysis (Bouras, Bustamante, Guo & Short 2023) finds Canadian markup growth explained less than one-tenth of 2021 inflation and was near zero or negative by 2022 — evidence against attributing that specific inflationary episode to firms flexing market power. It is a timing test of markup growth in one episode, not a rebuttal of the long-run markup-level literature this page rests on, but it warns against stretching this page's claim into a "greedflation" story about any particular price surge.
The Evidence in Detail
Four further sources round out the firm-rents record. Power & Frerick (2016) supply the tax-data decomposition: in US corporate tax-return microdata, the normal (risk-free) return share of the corporate tax base fell from roughly 40% (1992–2002) to roughly 25% (2003–2013) — excess returns rising toward three-quarters of the base, measured by the government's own tax analysts. Akcigit & Ates (2021) unify ten stylized facts of declining US business dynamism — rising concentration, markups, and profits alongside falling labor share — in an endogenous-growth model where slowing knowledge diffusion from frontier to laggard firms drives the trends. Zingales (2017) supplies the political-economy mechanism: a "Medici vicious circle" in which market power buys political power that entrenches market power. The 2016 Council of Economic Advisers brief is the official-institution corroboration: rising concentration, widening returns dispersion, and falling dynamism documented by the US government itself.
Strength of Evidence
Moderate–strong that the profit rise is real and abnormal — the markup, pure-profit, and dispersion methodologies are independent and agree on direction. Contested on interpretation: how much is extraction (market power, regulatory capture, network monopoly) versus mismeasured returns to intangible investment remains an active dispute, and the honest reading is "a substantial but not precisely known share is rent."
Relation to the Georgist Case
Henry George's analysis located unearned income in land; the modern rent literature finds structurally similar unearned income in corporate position. The policy translation is the same in spirit — tax the rent, not the production — though instruments differ (competition policy, spectrum/resource auctions, platform regulation, and rent-focused taxation — see the allowance for corporate equity and cash-flow tax designs — rather than a land value tax). See economic rent, rent-seeking, and the narrative The Rentier Economy.
Further corroboration. Korinek & Ng model how digital innovation — a fixed cost that then scales at near-zero marginal cost — lets a few firms capture rents, raising markups and lowering the labour share.
See Also
- Azar, Schmalz & Tecu: common ownership and airline prices — a concrete (and genuinely contested) rent-extraction channel: common institutional ownership associated with higher fares
- Rent-seeking drags economic growth — the growth cost of the rents documented here
- Superstar Firms · Economic Rent · Rent-Seeking · The Rentier Economy · Most of the modern rise in the capital share is land, not capital
- Philippon (2015): the finance-efficiency puzzle — the parallel evidence in the financial sector
- Kerspien, Madsen & Strulik (2025): Capital Composition and the Decline of the Labor Share — a non-market-power account of the same labour-share decline, attributing it to rising real building prices rather than to rising markups (a reminder that the falling labour share is over-determined)
- Commander, Estrin, Thomas & Lingineni: Business Groups, Concentration and Market Power in India — the same falling-concentration-but-rising-markups pattern documented outside the US, in Indian family-owned business groups
Sources
- Jan De Loecker, Jan Eeckhout & Gabriel Unger (2020), "The Rise of Market Power and the Macroeconomic Implications," Quarterly Journal of Economics 135(2). DOI — used for the markup rise (≈21%→61%, 1980–2016) and its concentration in the upper tail.
- Simcha Barkai (2020), "Declining Labor and Capital Shares," Journal of Finance 75(5). DOI — used for the falling labor and required-return capital shares and the rising pure-profit share, 1984–2014.
- Jason Furman & Peter Orszag (2015), "A Firm-Level Perspective on the Role of Rents in the Rise in Inequality," Columbia University "A Just Society" conference. PDF — used for the ROIC-dispersion evidence and the rents interpretation.
- Thomas Philippon (2019), The Great Reversal: How America Gave Up on Free Markets, Harvard University Press. Publisher — used for the US–Europe competition divergence and the lobbying/regulatory-barrier mechanism.
- Jan Eeckhout (2021), The Profit Paradox, Princeton University Press. Publisher — used for the synthesis of market-power evidence and its wage implications.
- Nicolas Crouzet & Janice Eberly (2019), "Understanding Weak Capital Investment: the Role of Market Concentration and Intangibles," NBER WP 25869 / Jackson Hole symposium. NBER — used for the intangibles counter-interpretation and the sector decomposition.
- David Autor, David Dorn, Lawrence Katz, Christina Patterson & John Van Reenen (2020), "The Fall of the Labor Share and the Rise of Superstar Firms," QJE 135(2). NBER — used for the winner-take-most efficiency counter-reading.
- Mariana Mazzucato, Josh Ryan-Collins & Giorgos Gouzoulis (2023), "Mapping Modern Economic Rents," Cambridge Journal of Economics (venue per the wiki's research page). UCL — used for treating intangible/platform returns as the modern frontier of rent analysis.
- Laura Power & Austin Frerick (2016), "Have Excess Returns to Corporations Been Increasing Over Time?", National Tax Journal / Treasury OTA WP 111. Treasury — used for the tax-return decomposition of normal vs excess returns. Magnitudes verified against the Treasury PDF (abstract): the fraction of the C-corporation tax base attributable to the risk-free return "has gradually declined over time, averaging 40 percent from 1992–2002 and 25 percent from 2003–2013."
- Stephen Maher & Scott Aquanno (2026), "Monopoly or competition? Unraveling the Amazon paradox," Review of Radical Political Economics, published online 5 March 2026, DOI 10.1177/04866134261415639. journals.sagepub.com — full text not accessible at last review (2026-08-29); the summary rests on the published abstract, quoted verbatim — used for the "real competition" counter-argument against reading Amazon as a monopoly-rent case (§"The Counter-Case" above) (B-claim; abstract-level).