The next major market crash is due quite soon, I’ll place my bets on 2027. It will be accompanied by a 3-4 year recession in the US with major global consequences as AI will slow down the pace of rehiring, deepening and prolonging the impact of the recession. We all feel it in the air, it’s coming soon, but no one is quite sure when or why. This article puts together insights from over 100 years of study by economists and researchers on a cycle that no one is talking about, but predicts when and how long the the pain will be. It’s a boom and bust cycle driven by our economic relationship to land, called a real estate cycle for simplicity.
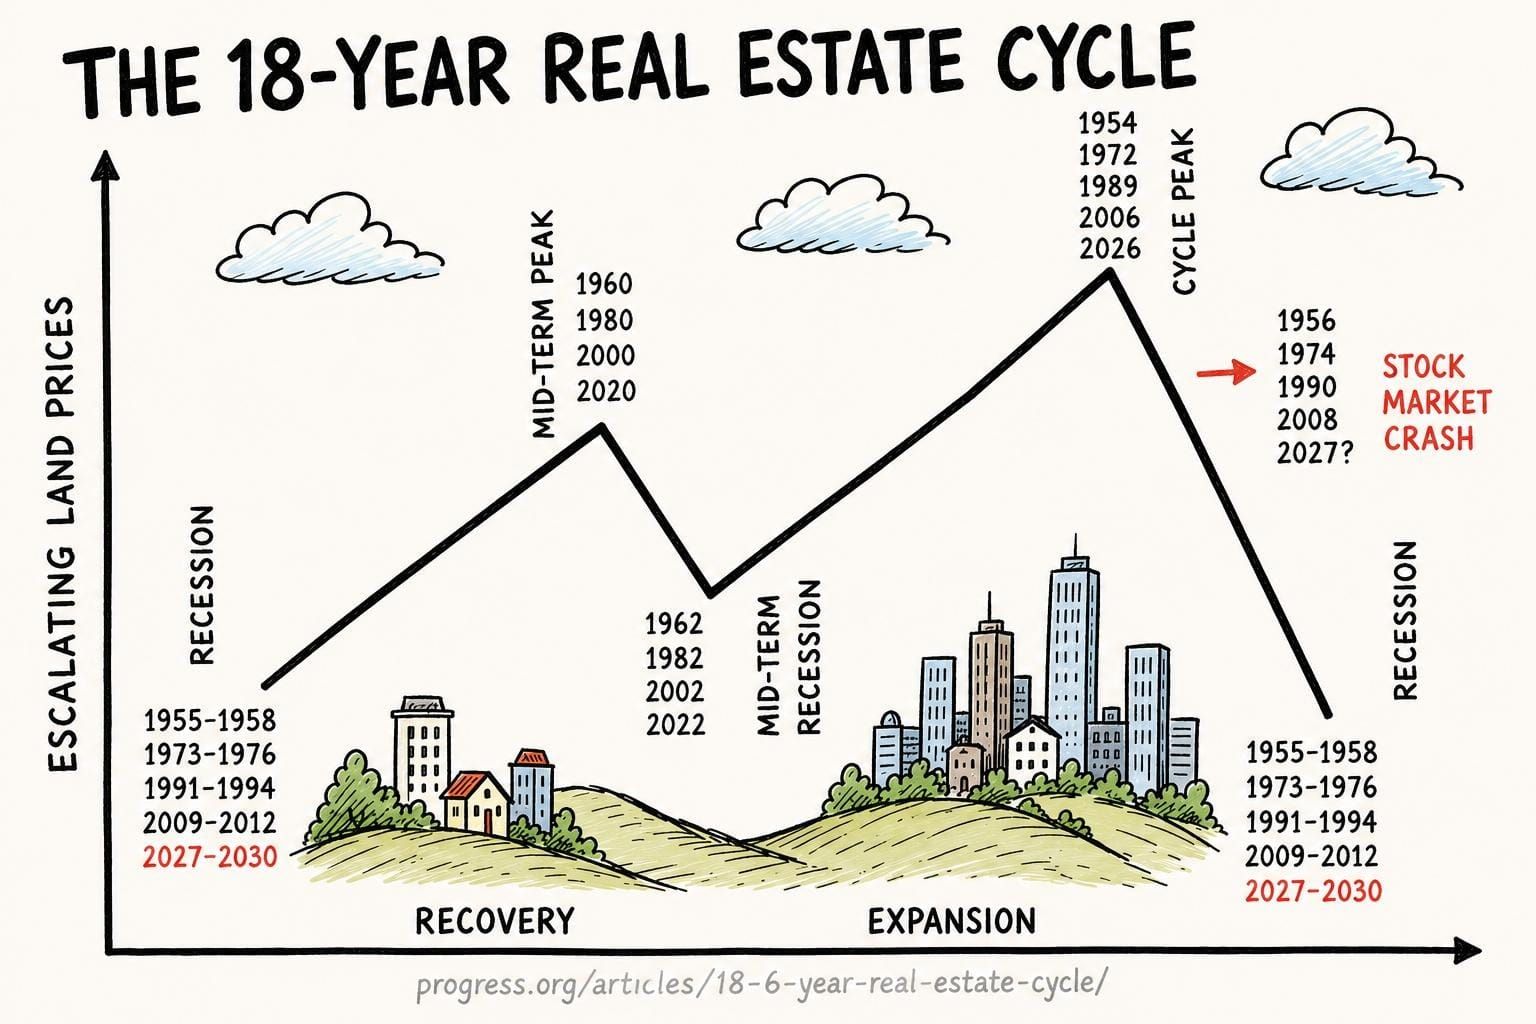
The 18.6-year real estate cycle sees land prices rise for ~14 years, then fall for ~4 years, each downswing accompanied by a major stock market crash, such as 1929 (−86%), 1973–74 (−48%), 1990(−20%), and 2008 - 2009 (−57%). The 2002 dot-com crash (−49% S&P / −78% Nasdaq) was a mid-cycle correction, not an end-of-cycle event, also following a decline in housing prices after the cycle’s mid-term land price peak. The next crash is due sometime 2026–2028. I’ll place my bets on 2027.
The cycle is an average, it’s not exactly 18.6 years apart every time. Understanding the cycle changes how you see every recession, every housing boom, and every market crash. The cause is not interest rates, inflation, or political mismanagement. Those are symptoms. The cause is rising land prices — driven by speculation and amplified by bank lending — becoming unsustainable for productive economic activity, until the system can no longer sustain its own weight and all other bubbles pop as consumer spending slows down. Later in this article I explain why land prices follow this pattern, and what can be done about it.
I came across this cycle as an advocate for land value tax. What a gift that has been. I’ve made many investment decisions based on it, and it has been a good compass to understand how to allocate your portfolio at different phases of the cycle.
The Intellectual Lineage
The ideas behind this cycle have been developed for over 100 years by a lineage of economists and researchers who, despite reaching broadly similar conclusions, are rarely cited together.
The empirical foundation was laid by Homer Hoyt in his 1933 University of Chicago dissertation, which documented land-price peaks in Chicago at approximately 18-year intervals stretching back to 1836: peaks at 1836, 1856, 1872, 1890, and 1925. Hoyt's data set was extraordinary — he analyzed 100 years of land values in a single city in granular detail. After World War II, Hoyt claimed the cycle was dead — yet simultaneously invested heavily in rising post-war land values, contradicting his own claim. The contradiction itself became evidence that the cycle had not died.
Fred Harrison caught the contradiction. A British author, economist, and economic commentator, Harrison has spent decades warning of the dangers of using land and real estate as the primary drivers of economic growth. In The Power in the Land (1983), Harrison proved the cycle had survived the war by analysing Hoyt's own post-war real estate dealings. He also predicted the 1990 property bust and mapped the general cycle pattern forward through 2026. In Boom Bust (2005), Harrison predicted a major depression beginning around 2010 — he had warned Gordon Brown as far back as 1997 that the UK economy would hit the cycle peak in 2007 and turn down into depression in 2010. He was confirmed by Dirk Bezemer, a professor of economics at the University of Groningen, who identified Harrison as one of the earliest predictors of the 2008 financial crisis.
Fred Foldvary, writing in the American Journal of Economics and Sociology in 1997, synthesised the Georgist land cycle with Austrian capital theory and predicted — eleven years in advance — that "the next major bust, 18 years after the 1990 downturn, will be around 2008." It was confirmed.
Phil Anderson's The Secret Life of Real Estate and Banking (2008) traced the cycle through 200 years of US history, identified consistent leading and lagging indicators in each cycle, and developed the investment framework that is now applied by Property Share Market Economics (PSE). Anderson's approach goes beyond documenting the cycle — he provides a practical investment clock for navigating it. I am a subscriber and client of PSE, and many of the investment insights and analytical frameworks in this article draw from what I have learned through their research.
Akhil Patel of PSE extended Anderson's work in The Secret Wealth Advantage (2026), providing an updated framework for applying cycle analysis to modern investment decisions across property, equities, and commodities.
Mason Gaffney, the dean of Georgist economics, documented the cycle's persistence across 800 years of Western economic history and identified land taxation as the structural remedy that would dampen or eliminate it. His work connects the cycle directly to the broader Georgist critique: that land is not produced by human effort, its value is created by the community, and allowing private capture of that value is the root source of recurring economic crises.
Josh Ryan-Collins and colleagues (Rethinking Land and Housing, 2017) added the credit channel: demonstrating that bank mortgage lending — not just speculative appetite — is the primary modern amplifier, and mapping three UK boom-bust cycles directly to deregulation events.
Henry George himself, writing in Progress and Poverty (1879), identified the core mechanism long before the cycle was formally documented. George's insight was that land — unlike labour or capital — is not created by human effort. Its value rises as society and communities develop around it. When that value is privatized rather than taxed, it creates the speculative dynamic that drives the boom-bust cycle.
This article is an attempt to synthesize their work, from which I made heavy use of AI across all of their publications.
How the Cycle Works: 14 Up, 4 Down

Once you understand the structure of the cycle, you can't unsee it. Every recession, every housing boom, every "unexpected" financial crisis snaps into place. The cycle has five distinct phases, and each one has a characteristic feel — a psychology, a set of signals — that repeats with remarkable consistency.
- Recovery (years 1–7): Land prices begin recovering from the trough. Credit loosens. Construction picks up. Confidence returns slowly. This is the phase where the best long-term investment opportunities typically appear — though most people are still too traumatized by the prior bust to act.
- Mid-cycle peak and recession (around year 7): A brief slowdown — a mini-recession — occurs roughly halfway through the upswing. Stock markets correct. Then the recovery resumes. This is often mistaken for the end of the cycle, leading investors to sell too early.
- Winners' Curse phase (years 12–14): The final speculative surge. Everyone is "all-in." Land prices rise fastest. Leverage is highest. Volatility increases. This is the most dangerous phase for investors who mistake momentum for safety. The psychology of this phase is powerful — FOMO is at its peak, and the very people who should be reducing exposure are often increasing it.
- Cycle peak: Land prices top out. Rising interest rates become unsustainable — but they are the effect, not the cause. The cause is land values too high relative to productive capacity. The peak is often invisible in real-time because confidence is at its maximum.
- 4-year downturn: Credit contraction. Land values fall. Bankruptcies cascade through the banking system. Stock markets typically crash 1–2 years after the land peak, not simultaneously. The severity of the downturn depends on how much leverage has built up during the boom.
What makes land uniquely explosive as a financial asset — and what The Economists’ Wall Street editor Mike Bird emphasizes in The Land Trap (2025) — is that it does not depreciate. Unlike a machine that rusts or software that gets obsolete, land holds its value across generations. This makes it the ideal collateral: banks can lend enormous amounts against it without fear of it decaying. As populations grow and cities develop, that collateral becomes more valuable, justifying still-larger loans, which bid land prices higher still.
This means that rising land values expand the money supply through new mortgage credit, which flows into the broader economy as more spending on labour, materials, and investment. While the media is obsessed with government money printing as a form of stimulus, the 18.6 year cycle explains how real estate speculation increases credit stimulus on the economy through more mortgages, but after the land prices peak, it all gets quickly unwound.
Not only does the economy see reduced credit driven stimulus as housing sales and prices decrease, but people start to spend less as they see their networth declining. This is the wealth effect in reverse. When land and housing values rise, homeowners feel wealthier — and they spend accordingly, drawing on home equity lines of credit or simply loosening their budgets because their balance sheet looks healthy. Studies consistently find that each dollar of housing wealth gain generates roughly 5–8 cents of additional annual consumer spending — a meaningful macro stimulus given that housing is the largest single asset most households will ever own. When that same housing wealth contracts, the effect runs in the opposite direction: households retrench, defer major purchases, and pay down debt rather than spend. Because housing wealth is far more broadly distributed across the population than stock market wealth, this reverse wealth effect hits consumer spending harder and more broadly than an equivalent equity market decline. Mike Bird captures the asymmetry precisely: the upswing delivers a "prolonged credit boom" that lifts spending economy-wide; the collapse is a "sudden evaporation of credit" compounded by a simultaneous collapse in household net worth — two deflationary forces hitting at once, which is why land-cycle busts produce the kind of multi-year stagnation that equity-only crashes typically do not.
And with reduced consumer spending, all other bubbles, ponzi schemes, shenanigans, and rackets running in the economy start to burst, whether it be sub-prime mortgage backed securities suddenly not working anymore, or the upcoming AI bubble popping as less consumer spending makes anticipated future revenue growth in the AI sector - and the insanely high price to earnings ratio’s unsustainable.
The Credit-Land Feedback Loop
Ryan-Collins's research also shows that the mechanism that turns a predictable land price cycle into an over all recession & economic crisis is bank mortgage credit. UK land values rose 15× since World War II, while the physical structures built on that land rose only 5×. The difference is pure land price inflation, funded by lending. Banks don't primarily lend money to create new productive enterprises — they lend to buy land and existing assets, inflating prices without creating new wealth.
Ryan-Collin’s maps three UK boom-bust cycles map directly to credit deregulation events:
- 1971–74: The Competition and Credit Control reforms deregulated lending → mortgage surge → property peak August 1972 → crash 1974
- 1988–92: Thatcher-era building-society deregulation; 95%+ loan-to-value mortgages appeared → peak 1988 → crash through 1992
- 2005–08: Basel II 50% risk-weighting on mortgages combined with RMBS securitisation → global peak 2007 → crash 2008–09
Ryan-Collins's research raises an important nuance worth acknowledging: his position is that the 18-year cycle is primarily credit-driven, not structurally baked in — pre-deregulation periods (1945–1970) showed suppressed cycles. Harrison, Anderson, and Foldvary treat the cycle as structural across centuries. Both can be true: the 18-year rhythm may be intrinsic to land speculation, suppressed by capital controls after WWII and reactivated by credit liberalisation from the 1970s onward. Either way, the practical implication is the same — when credit flows freely against rising land collateral, the cycle amplifies dramatically.
Mike Bird makes the downward spiral explicit: when land prices fall, banks retrench — they stop lending, which drives land prices lower still, causing banks to withdraw further. Japan in the 1990s is the most extreme case, but the pattern repeats in every cycle. Critically, the damage extends to people with no property at all. When credit dries up, employers can no longer borrow to fund operations or expansion; layoffs follow. As Bird puts it, this is "the classic Keynesian paradox of thrift" — a contraction felt by every worker regardless of whether they own land or have any stake in the housing market. The feedback loop is asymmetric: it accelerates more violently on the way down than on the way up, because collateral destruction and employment destruction reinforce each other.
Historical Cycle Record
What convinced me that this wasn't theory was the historical record. Nearly 200 years of data across wildly different political environments, monetary systems, and technological eras — and the same pattern keeps showing up. The cycle is not a product of capitalism, democracy, gold standards, or fiat money. It is a product of how land is owned and taxed.
Housing / Land Prices
| Cycle Trough | Peak | Next Trough | Key Evidence | Yrs Peak to Previous Peak |
|---|---|---|---|---|
| ~1818 | 1836 | ~1840 | Hoyt (1933) — earliest documented Chicago peak | — |
| ~1843 | 1856 | ~1858 | Hoyt (1933) | 20 yrs |
| ~1862 | 1872 | ~1878 | Hoyt (1933) | 16 yrs |
| ~1878 | 1890 | ~1894 | Hoyt (1933) | 18 yrs |
| ~1908 | 1925 | 1933 | Hoyt (1933); Florida land boom; Dow peaked 1929 | 35 Years ⚠️ WWI gap |
| 1941 | 1955 | 1956 | Stacey (PSE 2026) | 30 Years ⚠️ WWII & Korean war gap |
| ~1958 | ~1972 | 1974–75 | Harrison (1983); Ryan-Collins (2017) Stacey (PSE 2026) | 17 |
| ~1975 | 1989 | 1990–92 | Harrison predicted in 1983 ✓ Stacey (PSE 2026) | 17 yrs |
| 1990–92 | 2006 | 2011–12 | Foldvary predicted in 1997 ✓; Harrison predicted in 2005 ✓ Stacey (PSE 2026) | 17 yrs |
| 2011–12 | 2026 ⏳ | ~2030? ⏳ | PSE 2026 Roadmap; Anderson (March 2026): top not yet confirmed | ~18 yrs ⏳ |
The most striking thing about this table is the column of confirmed predictions. Foldvary wrote in 1997 that the next bust would be "around 2008." Harrison warned Gordon Brown in 1997 that a depression would begin in 2010. These weren't lucky guesses — they were the output of a theoretical framework applied consistently. That's what gives me confidence in the current window.
The Stock Market and the Land Cycle: Two Distinct Events
One of the most important — and most misunderstood — insights from the cycle research is that the housing crash and the stock market crash are not the same event. The critical pattern, documented across multiple cycles: the equity peak typically lags the residential real estate peak by anywhere form a few months to three years. The average lag is 16 months. Land and housing prices turn down first. Equities continue rising, oblivious to the effect of slowed consumer spending and reduced credit stimulus affecting the broader economy, until things start to break.
The 1920s provide the clearest example. US land prices peaked in 1925–26. The Florida land boom collapsed in 1926. Yet the Dow Jones Industrial Average continued rising for a further three years, peaking in September 1929 — by which point pure equity speculation and consumer credit had filled the gap left by the land market's retreat. The subsequent crash erased 89% of the Dow's value.
The cycle-by-cycle evidence for this lag:
| Real Estate Peak | Equity Peak | Lag | Equity crash magnitude |
|---|---|---|---|
| 1925–26 (Florida/urban US) | Sept 1929 (Dow) | ~3 years | −89% (Dow, 1929–32) |
| 1988–1990 (UK/US) | ~Aug 1990 | ~11 months | Moderate (−20%) |
| 2005–2006 (US) | Oct 2007 (S&P 500) | ~16 months | −57% (S&P 500, 2007–09) |
| 2026 (projected) | 2027–29? | TBD | TBD ⏳ |
It's also worth distinguishing end-of-cycle crashes from mid-cycle corrections. End-of-cycle crashes — where the full land cycle terminates — produce the most severe and sustained damage: 1929–32 (−89% Dow), 2007–09 (−57% S&P 500). But the cycle shows that there is usually a mid-cycle pull back in real estate markets, which in a similar fashion leads to an unwind in other speculative bubbles occuring at the time, such as the dot-com bust of 2001–2002 (−49% S&P 500).
This distinction of land / housing crashes vs. equities crashes explain why land-cycle crashes produce far more severe equity damage than pure equity bubbles. Mike Bird's comparison is instructive: the dot-com bust of 2000–01 caused almost no macroeconomic spillover because there were no bank failures — the people who lost money were those who had directly invested, "which is how it should work." But when land is aggressively collateralised in the banking system, any collapse in land prices is, as Bird describes it, "pulling on a web of strings — and everything attached comes piling in." The banking transmission mechanism is what turns a real estate correction into a broad economic crisis: falling land values impair bank balance sheets, credit contracts, employers can't borrow, jobs are lost, consumer spending falls — and only then do equities crash, not as the cause but as the consequence. This is why end-of-cycle crashes produce those −57% and −89% numbers while 2001, a mid-cycle correction with an intact banking system, was severe but comparatively contained.
However, a severe equity crash does not always signal land-cycle termination. This distinction matters enormously for not panicking during market corrections when the right move is often to hold or add. Knowing where you are in the cycle, leads to more confidence in staying in the market if you’re not near the cycle’s end point.
The Role of Commodities and Other Asset Classes
The cycle does not only affect land and equities. Anderson's framework maps the relationship between land prices, stock markets, commodities, and currencies across the cycle. Commodities — oil, gold, metals — tend to peak near the end of the cycle, as the final speculative surge drives demand for hard assets. This creates the characteristic end-of-cycle signature: soaring commodity prices, euphoric equity markets, and land prices beginning to top out, all happening within a window of one to three years.
Understanding these relationships allows investors to triangulate where they are in the cycle using multiple asset classes as confirmation signals.
Where We Are Now: The 2026 Window
The current cycle began its upswing from the 2011–12 lows. That is now 14 years ago — precisely the historical length of the upswing phase. The projected peak window, per Phil Anderson's PSE framework and Fred Harrison's 2022 prediction, is 2026–2028.
As of March 2026, Anderson had not yet confirmed the cycle top. The scenario being watched most closely is the "Jazz Age" analog: equities continuing to rise past the residential real estate peak — as they did from 1926 to 1929 — before the eventual top is confirmed.
Several signals Anderson identified as end-of-cycle markers have appeared: private credit stress (early 2026), rising longer-term interest rates against inflated land values, and Bitcoin's significant correction from its 2025 highs. None of these individually confirms the top — they are the characteristic texture of the late cycle.
The Root Cause and the Remedy
The cycle is not an accident of human psychology or market inefficiency. It is a structural consequence of how modern economies treat land.
Land — unlike labour or capital — is not produced by human effort. Its value is created by the community: by public infrastructure, by proximity to economic activity, by population growth. Under current arrangements, that community-created value accrues to whoever holds title to the land. Banks lend against it. Speculators bid it up. And the cycle runs.
Mike Bird highlights how economic growth driven by the land credit cycle also sows the seed of its own destruction - the same credit boom that fuels the stimulus also crowds out productive investment, because capital flows toward land speculation instead of genuine enterprise. So the stimulus is real but increasingly hollow toward the end of the cycle. Land booms misallocate credit from productive young firms to land-rich incumbents, dragging GDP down DURING the boom. That’s why real-estate drunk economies like Canada (where I live) are seeing a slow down in economic growth - as housing becomes a larger part of GDP, the real economy suffers.
Henry George identified the remedy in 1879: tax the economic rent from land rather than taxing labour and capital. A land value tax returns the community-created surplus to the public, removes the speculative incentive to hold land idle, and — as Gaffney documented — would dampen or eliminate the cycle by cutting off its fuel supply. The value of land could theoretically flow all the way to ZERO, if we replaced enough other taxes on income and capital gain instead with a tax on the rents of land. Imagine if young people could buy a home where the land part costs nothing. That means buying while they are younger, smaller deposits, smaller mortgages.
The cycle is not merely theoretical. As Gaffney wrote: "The cycle has persisted over the last 800 years. Major wars and plagues have broken the rhythm, but the cycle has persisted." The structural remedy has been known for nearly 150 years. The cycle continues because the remedy has not been applied.
If we ever find our way to implementing land value tax — capturing the community-created value of land and returning it to the community — this 18.6-year cycle will disappear. In its place we would have the slow, steady growth that supports a genuinely prosperous and stable civilization. That is what I and all of the authors listed in sources are working towards. My personal work is in having founded and am primary donor to Common Wealth Canada, a Canadian focused think tank promoting policies based on the idea that natural and publicly created wealth should be publicly shared. Doing so can fix the housing crisis, replace harmful taxes on work and productivity, fund dividends to every citizen, and steward our finite resources for the benefit of future generations. Related to this is another non-profit venture UBI Works, a focused on advancing a guaranteed basic income to mitigate the impacts of accelerating job automation and economic polarization caused in large part by our economic relationship to land. 2/3 of people in poverty are working, and they will never outrun rising housing costs as long as land & housing is treated as a wealth creation vehicle, as opposed to a place to live.
Learning More: Where to Go From Here
If you want to go deeper on the cycle — and especially if you want to understand how to apply it to investment decisions — I highly recommend subscribing to Property Share Market Economics (PSE). Phil Anderson and Akhil Patel have spent decades building the most rigorous and practical investment framework around the 18.6-year cycle. Their work is where I learned most of what I know about applying the cycle in practice.
PSE offers a free newsletter to start, and paid membership tiers for those who want deeper analysis, cycle roadmaps, and investment guidance across property, equities, and commodities.
Key Sources
- Homer Hoyt, One Hundred Years of Land Values in Chicago (1933)
- Henry George, Progress and Poverty (1879)
- Fred Harrison, The Power in the Land (1983); Boom Bust (2005/2010)
- Fred Foldvary, "The Depression of 2008," American Journal of Economics and Sociology (1997)
- Phil Anderson, The Secret Life of Real Estate and Banking (2008)
- Mason Gaffney, "The Role of Land Markets in Economic Crises," AJES (2009)
- Josh Ryan-Collins, Toby Lloyd, and Laurie Macfarlane, Rethinking Land and Housing (2017)
- Akhil Patel, Secret Wealth Advantage (2026)
- Cathy Stacey, 14 Up, (2026 PSE member mag)
- Mike Bird, Wall Street editor of The Economist, The Land Trap: A New History of the World's Oldest Asset (2025)