What's Manhattan Worth? A Land Values Index (Barr, Smith & Kulkarni)
Peer-reviewed vacant-land-sales index that values all developable Manhattan land at roughly $1.47 trillion in 2014 — a concrete data point in the aggregate-land-value span Doucet surveys, and a demonstration that pure-land transactions can price land in a dense city.
Summary
What's Manhattan Worth? A Land Values Index from 1950 to 2014, by Jason Barr (Rutgers), Fred H. Smith (Davidson College) and Sayali J. Kulkarni, was published in Regional Science and Urban Economics (Vol. 70, 2018, pp. 1–19); a free working-paper version circulated as Rutgers University Working Paper WP2015-002.[1] Using arm's-length sales of vacant (undeveloped) land, the authors build a quality-adjusted price index for Manhattan land across six decades and estimate the aggregate value of the borough's developable land.
The practitioner-author Lars Doucet cites the study in Does Georgism Work? Part 1 as one of the twelve methods spanning his ~$19–65 trillion aggregate US land-value range: Barr et al. supply a rigorously estimated, transaction-based value for a single ultra-dense market. Its methodological importance is larger than its single number — it shows that even in the most built-up city in the United States, enough pure-land sales occur to construct a defensible land-value surface, which bears directly on the assessment objection.
Key Findings
From the paper's abstract and results (verified verbatim against the working paper):[1]
- Aggregate value. "We estimate the entire amount of developable land on Manhattan in 2014 was worth approximately $1.47 trillion."[1]
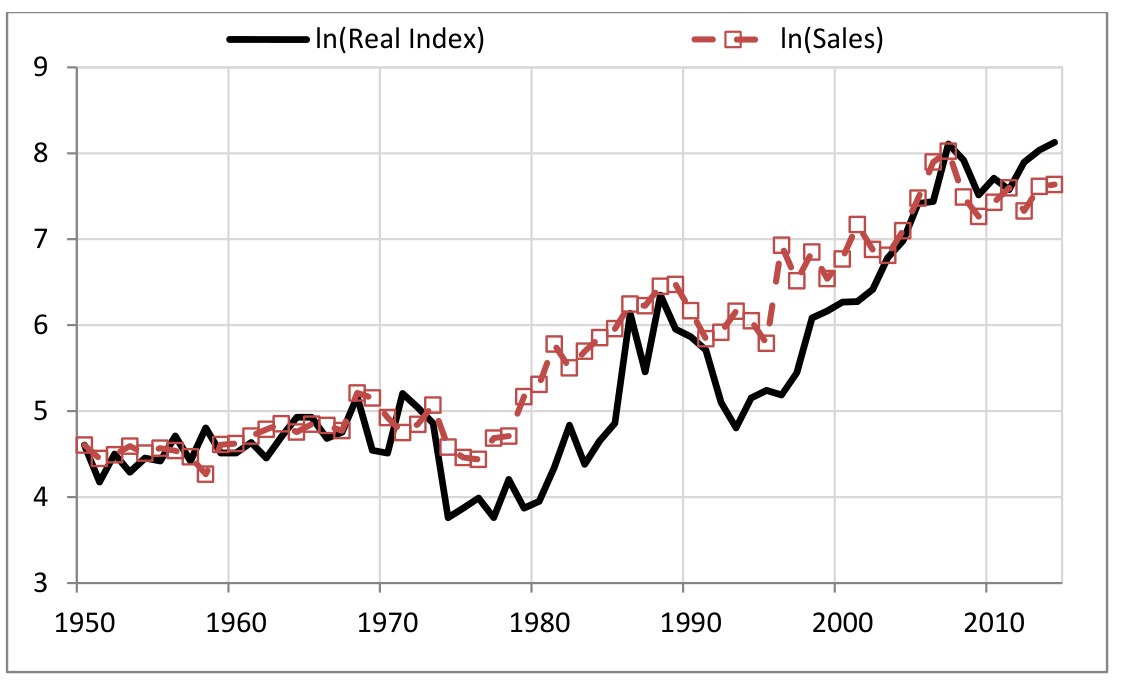
- Long-run growth. "Using vacant land sales, we construct a land values index for Manhattan from 1950 to 2014… Overall, we find the average annual real growth rate to be 5.5%."[1]
- Post-1993 acceleration. "Since 1993, land prices have risen quite dramatically, and much faster than population or employment growth, at an average annual rate of 15.8%, suggesting that barriers to entry in real estate development are causing prices to rise faster than other measures of local well-being."[1]
- Cycles and multi-century return. The index shows three major cycles (1950–1977, 1977–1993, 1993–2009), a nadir in 1977 just after the fiscal crisis, and an implied "average annual return of about 6.4% since the island was first inhabited by Dutch settlers in 1626."[1]
The vacant-land data for 1996–2006 were provided by CoStar; the authors combine these with archival sales to extend the series back to 1950.[1]
What It Supports
- Land is a big deal (magnitude). A single borough's developable land is worth ~$1.47 trillion — a vivid, transaction-grounded illustration of the concentration of value in urban location that underpins Doucet's Part 1. The finding that land prices since 1993 outran population and employment growth is a land-rent-capitalization story (barriers to entry accruing to landowners), congruent with the wiki's treatment of Rognlie and the capital-share debate.
- Vacant-land sales work even in a dense core. The study is direct evidence that the "there are no pure-land sales in built-up cities" premise of the land-cannot-be-assessed objection is overstated: Manhattan generated enough vacant-land transactions to index land value for 64 years. This complements the Kolbe Berlin study, where kernel interpolation from vacant-land sales failed in the very densest core and semiparametric methods were needed — Manhattan and Berlin together map the boundary of where pure-land sales suffice.
What It Cuts Against / Limits
- Not an assessment method. The index is a research price series, not an operational parcel-level assessment roll; it establishes that land can be priced from sales, not that every parcel is assessed accurately.
- Selection in vacant-land sales. Undeveloped lots that sell in Manhattan are unusual (often assembled or distressed), so the authors apply hedonic quality adjustment; the estimate is a modelled index, not a raw average.
- Working-paper vs published figures. The headline numbers above are quoted from the widely circulated 2015 working paper; the peer-reviewed Regional Science and Urban Economics article (2018) is the citable version of record and should be preferred where a reader has access.
See Also
- Doucet, Does Georgism Work? — where this is one of the twelve aggregate-land-value methods
- AEI Land Price and Land Share Indicators — a complementary residual-method land-share dataset used in Part 1
- Saez & Zucman, Wealth Inequality in the US since 1913 — the land/wealth-concentration companion in Part 1
- Kolbe et al.: Berlin land-value appraisal
- Mass Appraisal Methods
- Larson, New Estimates of the Value of Land of the US
Sources
- Jason Barr, Fred H. Smith & Sayali J. Kulkarni (2018), "What's Manhattan Worth? A Land Values Index from 1950 to 2014," Regional Science and Urban Economics, Vol. 70, pp. 1–19, DOI 10.1016/j.regsciurbeco.2018.02.005 (paywalled). Free working-paper version: Rutgers University Working Paper WP2015-002, PDF — used for the $1.47 trillion 2014 developable-land estimate, the 5.5% long-run and 15.8% post-1993 real growth rates, the three-cycle structure, and the vacant-land-sales methodology. All quoted figures verified verbatim against the working-paper PDF (2026-07-11). Note: the source is Regional Science and Urban Economics, not the Journal of Urban Economics — an earlier internal ledger mislabeled the venue.