New Estimates of Value of Land of the United States
A U.S. Bureau of Economic Analysis working paper estimating the total value of land in the contiguous United States at roughly $23 trillion (2009), using hedonic methods rather than the older residual approach.
Summary
"New Estimates of Value of Land of the United States" is a 2015 working paper (BEA Working Paper WP2015-3, dated April 2015; also catalogued as BEA Working Paper No. 0120) by William Larson, an economist at the U.S. Bureau of Economic Analysis (BEA) — the federal statistical agency responsible for the National Income and Product Accounts (GDP) and the U.S. national balance sheet. The paper was published as an official BEA working paper, not an academic journal article or advocacy piece, which gives it particular weight as a source: it is the U.S. government's own statistical agency producing a systematic land-value estimate using a stated, reproducible methodology, rather than an outside estimate of what land "should" be worth. Larson estimates that the roughly 1.89 billion acres of land in the 48 contiguous states and the District of Columbia were collectively worth approximately $23 trillion in 2009 (current prices), with the federal government holding 24% of the land area, valued at about $1.8 trillion. Because it comes from inside the U.S. statistical system rather than from a Georgist advocate, this figure functions as a mainstream, methodologically transparent anchor for arguments about the scale of land value in the land rent could fund government outcome.
The Core Argument / Findings
Larson's central methodological contribution is to estimate U.S. land value directly, using hedonic price methods, rather than by the indirect "residual" approach traditionally used in national accounts (subtracting an estimate of structure replacement cost from total real-property market value to leave land value as a residual). He develops hedonic estimates of land prices at a range of geographic scales — parcels, census tracts, and counties — covering multiple land uses (developed/residential, agricultural, and federal/other government-owned land), and interpolates across a mosaic of these units to produce a comprehensive national estimate.
Reported findings, verified directly against the working paper's full text (PDF · archived):
- Total land value: approximately $23 trillion for the contiguous U.S. plus D.C., valued at 2009 prices, covering about 1.89 billion acres. The abstract states: "Estimates suggest that this 1.89 billion acres of land are collectively worth approximately $23 trillion in 2009 (current prices), with 24% of the land area and $1.8 trillion of the value held by the federal government."
- Federal government land holdings: 24% of total land area but only 8% of total value, worth about $1.8 trillion — an average of $4,100 per acre for federal land versus $14,600 per acre for non-federal land.
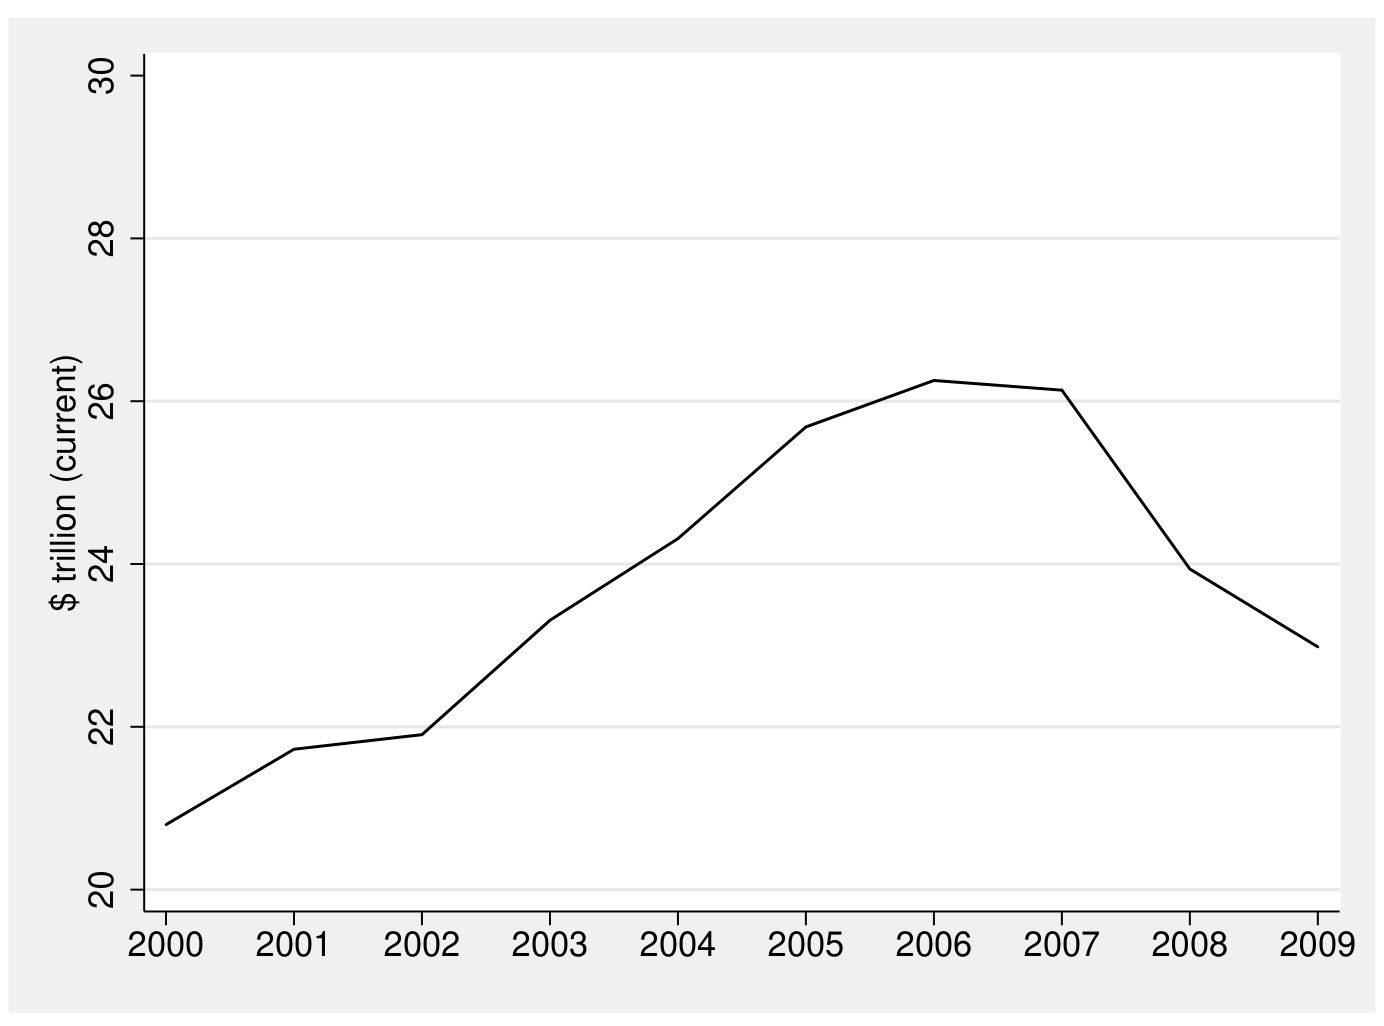
- A time path, not just a point estimate. Larson computes land value annually for 2000–2009: "From 2000-2006, the value rose 26% from $20.8 trillion to $26.2 trillion, after which, from 2006-2009, it fell 12% to $23.0 trillion" — direct evidence of how much land value swings with the property cycle.
- Value is intensely concentrated in developed land. Developed land is only 6% of the land area but 51% of total value (averaging $106,000 per acre), while agricultural land is 47% of the area but just 8% of the value (about $2,000 per acre) — the disaggregation that substantiates the Georgist point that land rent is concentrated in high-demand developed locations rather than spread evenly across acreage.
Contemporaneous coverage (Bloomberg, Forbes, 24/7 Wall St.) treated the $23 trillion figure — roughly 1.6 times 2009 U.S. nominal GDP of about $14.4 trillion — as a notable, citable government estimate of the scale of national land wealth, and it has since been used by commentators on both sides of the land-tax debate as a reference point for "how big is U.S. land value."
Relation to the Georgist Case
This paper supports the land-value-scale premise behind Georgist revenue arguments, but its relationship to the broader Georgist case must be stated precisely. Larson's paper is a measurement exercise — it estimates the stock value of land — not a policy paper, and it makes no claim about land value taxation, ATCOR, optimal tax design, or how much revenue a land value tax could sustainably raise. Any inference from "$23 trillion in land value" to "a land value tax could raise $X per year" requires an additional, separate step (choosing a capitalization or rental-yield assumption, and deciding which of the estimated land value would remain a legitimate LVT base after any behavioural response) that Larson's paper itself does not undertake.
Its value to the Georgist case is therefore as a credible, independent anchor figure: a federal statistical agency, using transparent hedonic methods rather than advocacy-driven assumptions, corroborates that U.S. land value is on the order of tens of trillions of dollars — a scale consistent with claims (e.g., Gaffney's "Hidden Taxable Capacity of Land") that land rent is large enough to be fiscally significant. It does not, by itself, establish that land rent is large enough to fund any particular share of government spending.
Nuances and Limits
- Stock value, not annual rent. The $23 trillion figure is a capital/asset value, not an annual rental flow. Converting it to a plausible annual land-rent figure requires an assumed capitalization rate; contemporaneous commentary (e.g., Tim Worstall's Forbes critique, cited below) applying illustrative rental-yield assumptions (e.g., ~5%) to Larson's estimate arrived at roughly $1 trillion or so in annual land rent — a figure critics have used to argue that land rent alone would cover only a fraction of current federal spending, not replace it entirely. That argument depends heavily on the assumed yield and is a downstream extrapolation, not a conclusion Larson draws himself; it also excludes state/local spending, resource rents beyond land per se, and any ATCOR-style base expansion argued for by Georgist writers.
- 2009 valuation date. The estimate is anchored to 2009 property values, near the trough of the U.S. housing bust; land values have moved substantially (in both directions across markets) since then, so the $23 trillion figure should not be read as a current-year estimate without updating.
- Geographic scope. The estimate covers the contiguous 48 states and D.C.; it excludes Alaska, Hawaii, and U.S. territories.
- Hedonic method has its own assumptions and error — and the paper says so. Larson's own robustness discussion states: "Various specifications and samples are used to estimate different land value parameters, with most resulting aggregate tabulations falling between $20 and $25 trillion. The estimates in the paper are therefore generally interpreted as having +/- 10% error," and he concedes that aggregate values "are robust to reasonable model alterations, but are of questionable sample robustness." He also compares his figures to prior residual-approach estimates built on the Federal Reserve/BEA Flow of Funds Accounts — for 2005, Davis & Palumbo (2008) put household-owned urban land at $9.7 trillion, Case (2007) put total land excluding government and rural non-farm land at $10.8 trillion, and Davis (2009) put non-government land at about $11 trillion, versus Larson's roughly $25 trillion all-land total for the same period — while noting (citing Davis 2009) that the Flow of Funds property-value measures "were not intended to be used for land accounting" and omit vast areas of land. A further definitional caveat from the paper: its "land" values include ecosystems, basic siting improvements (fencing, irrigation, clearing), and natural-resource stocks that convey with the land, an approach Larson notes "is not in accordance with System of National Accounts guidelines."
- Not a tax-policy document. As noted above, the paper does not address land value taxation, incidence, or revenue capacity; readers should not treat it as making or supporting any policy recommendation.
Bears On
- Outcome: Land rent could fund a large share of government — provides an independent, official-statistics estimate of the scale of the U.S. land-value base that revenue-sufficiency arguments depend on, though the paper itself does not estimate annual rent or revenue capacity.
- Objection: LVT can't raise enough revenue — the $23 trillion figure has been used on both sides of this objection: as evidence land value is large, and (via illustrative capitalization-rate extrapolations by critics) as evidence that annual land rent alone may fall short of total government spending.
- Concept: Mass Appraisal Methods (CAMA, Hedonic Regression, Land/Building Separation) — Larson's hedonic, direct-estimation approach is a real-world national-scale application of these methods, in contrast to the older residual approach.
- Concept: Economic Rent — a land-value stock estimate is the necessary starting point for any argument about the scale of land rent as a flow.
See Also
- Albouy, Ehrlich & Shin (2018), Metropolitan Land Values
- Recording Land in the National Balance Sheet (London Group, 2009) — official statisticians' account of the residual-vs-direct valuation problem this paper's hedonic approach addresses
- Land Value Tax
- Economic Rent
- Mass Appraisal Methods (CAMA, Hedonic Regression, Land/Building Separation)
- Gaffney — The Hidden Taxable Capacity of Land
- Objection: LVT can't raise enough revenue
Sources
- William Larson (2015), "New Estimates of Value of Land of the United States," BEA Working Paper WP2015-3 (dated April 3, 2015; also catalogued as BEA Working Paper No. 0120). BEA landing page; full-text PDF · archived — the full primary text, used and quoted directly for all figures on this page: the headline findings ($23 trillion, 1.89 billion acres, 24%/$1.8 trillion/8%-of-value federal share), the 2000–2009 time path, the land-use disaggregation and per-acre values, the robustness/error discussion, the comparison to residual-method Flow of Funds-based estimates, and the SNA-definition caveat.
- IDEAS/RePEc, "New Estimates of Value of Land of the United States." RePEc — used to corroborate the working paper series/number, author affiliation, and JEL classification (E60).
- Tim Worstall, "Fun Number: The US Is Worth $23 Trillion. Or, Why A Land Value Tax Won't Work," Forbes, April 23, 2015. Forbes — used for the contemporaneous critique illustrating how commentators extrapolated an annual-rent figure from Larson's stock estimate via an assumed capitalization rate, and the resulting revenue-sufficiency argument.
- Bloomberg, "The Real Role of Land Values in the United States," April 10, 2015. Bloomberg — used to corroborate the headline figures' contemporaneous reception as a citable government estimate.