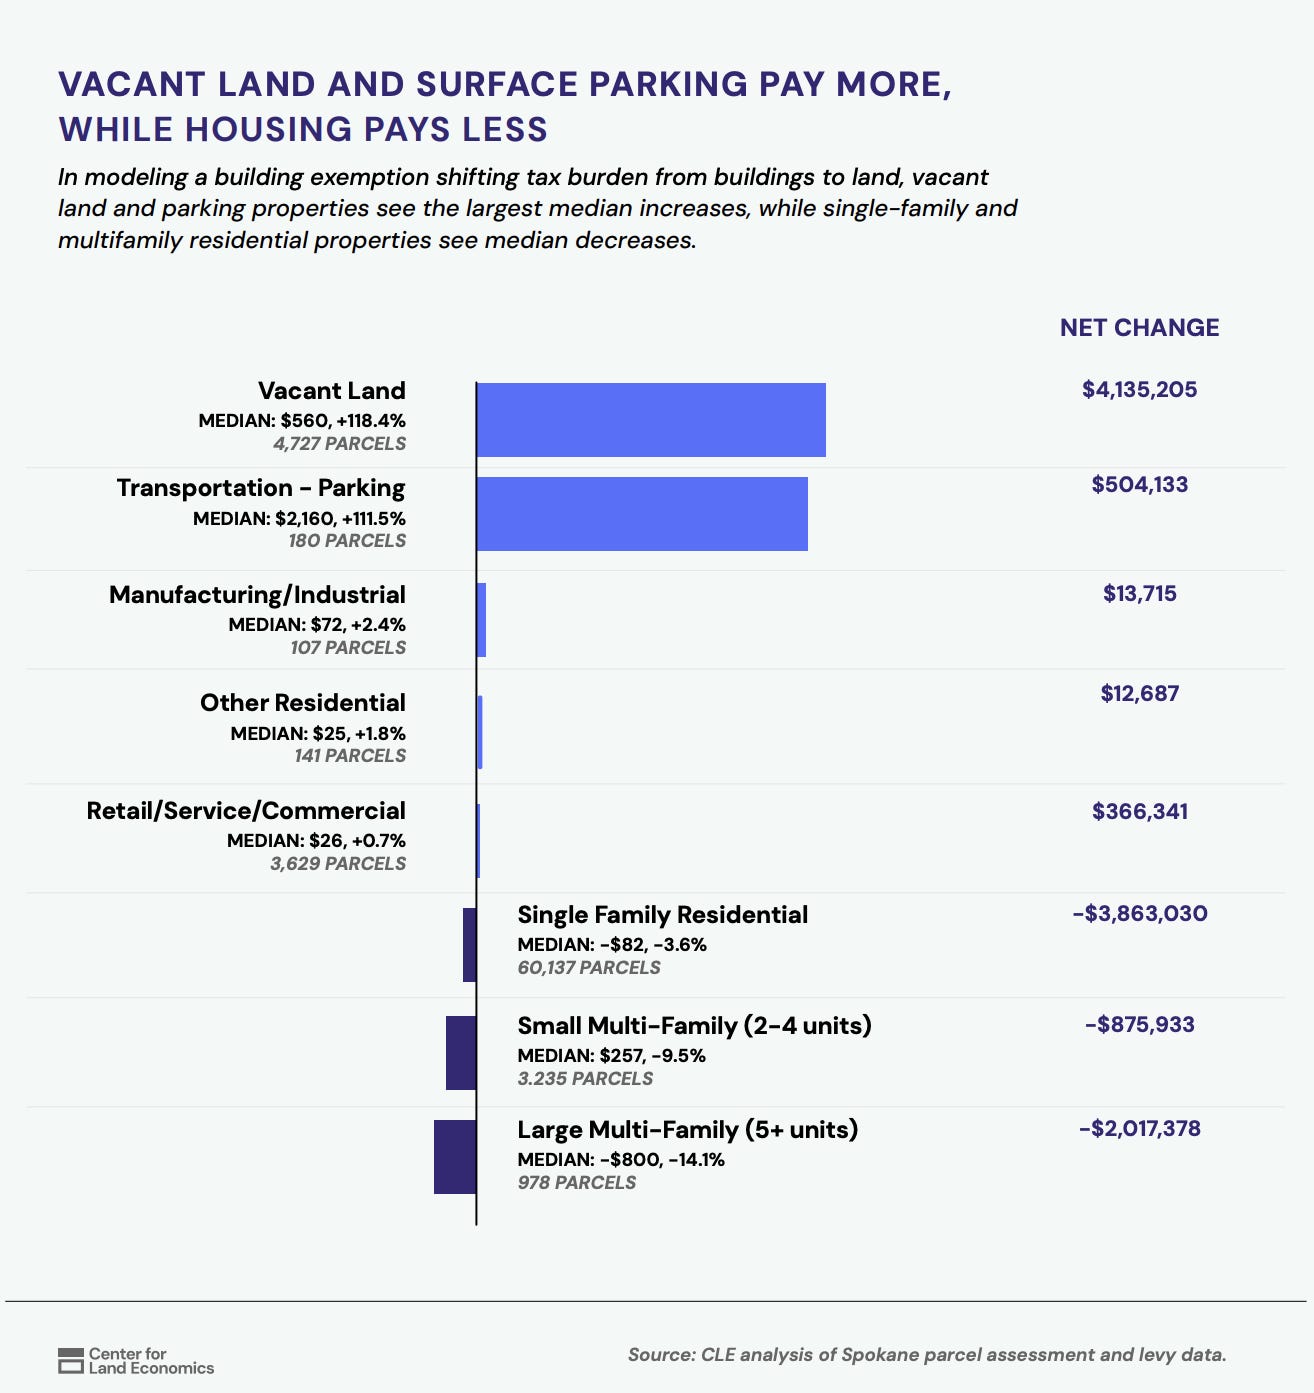
“The results for my city don’t look politically good”
That happens, and it is worth saying plainly what “not good” usually looks like: single-family homeowners seeing a big increase, or low-income neighborhoods taking the hardest hit. If that is what your first model shows, here are a few things to keep in mind.
First, you can try a different policy. A 2:1 or 4:1 split instead of a full shift. If you are doing an exemption approach, a flat exemption on the first $100,000 of building value can change the picture a lot.
Second, you can model tax districts, rather than doing a city-wide shift. Often the goal of a land value tax shift is to bring a downtown back to life, and downtowns are exactly where land values are highest, so that is where the shift does the most work. Drawing the policy around the downtown corridor concentrates the benefit where it matters and keeps it off the parcels you are worried about.
Third, even “only okay” results are better than they look on the page. These models cover the tax bills of people who own land. In a lot of cities that leaves out the 40% of residents who are renters and own no land at all. Renters gain from this policy overall, especially as more housing brings down rents.
In addition, perhaps more importantly, this modeling is the one-time static impact of tax bills. The purpose of a land value tax shift is not for tax redistribution. It is meant to long-run encourage development while ensuring a balanced local budget.
What about Agriculture?
I usually leave agriculture out of the analysis. On farmland, much of the value sits in the land itself, since the “improvements” are often things done directly to the soil, so assessments tend to show high land values. That means an LVT shift tends to raise the tax burden on ag land, which makes a proposal harder to pass. Urban land is where values are highest and where the shift goes furthest anyway, so that is where I prefer to focus. It is a preference, though, not a hard rule.
How do I know if my city’s land values are good?
Good question, and one we are building more material to answer. In the meantime, I recommend reading Lars’ article on land valuation to understand the theory on what good values would look like. Until there is a full set of tests, here is what to look for:
First, has your city completed a revaluation recently? If it’s been a while then the valuations may not be reliable.
Second, look at the land values. Do they make intuitive sense? Do the areas you know to be the most valuable have higher land values? Do the poorer areas have lower land values?
Third, are land values locally flat, or is there tons of side-by-side variation? You don’t expect them to be perfectly smooth, but if they’re very noisy, that’s surprising.
Fourth, do land values spike where we naturally expect them to—along transit corridors, along commercial corridors, in the city center, in wealthy neighborhoods, along premium waterfront, along golf courses, etc?
What do I do with this modeling?
The modeling should serve as the data behind the work you do, but data alone does not change minds. You will need to pair the data with story-telling, as well as coalition building and elite persuasion. We have written a playbook on steps to advocating for land value taxes in your local area, and it should serve as a good guiding point.
The repo is a starting point
All of this is a starting point. Have a question? Want to model something different, or see a new kind of graphic? Ask your coding agent.
And if you have ideas for improving the skills, find yourself correcting the agent over and over, or want a skill that does not exist yet, let me know or open a PR.
Progress and Poverty is a reader-supported publication. To receive new posts and support my work, consider becoming a free or paid subscriber.
Editor
· 9 min read · Jun 2026