
Originally published on Henry George Foundation on September 10, 2026. Republished on Progress.org with permission.
The previous two Empirical Insights posts highlighted the growing importance of wealth relative to income and the way the wealth gap is written onto the landscape in the form of geographic inequality. This post begins the somewhat complicated and lengthy process of identifying the key drivers of these disparities and inequalities. It does so by focusing on the following question: What have been the fastest-growing sources of household wealth in Britain in recent years and decades?
I suspect that most people reading this article would assume, without having to think too hard about it, that the fastest growing source of household wealth in Britain would almost certainly be the value of residential land. And they’d be absolutely right to assume this – but only if they were thinking in terms of recent decades rather than recent years. The rise in importance of wealth in the UK since 1970 certainly is closely related to the increasing value of housing wealth. According to the Institute for Fiscal Studies, while housing constituted 11% of the wealth of the top 1%, and 22% of the wealth of the top 10% in the UK in 1971, by 2012 the figures had risen to 32% and 45% respectively.
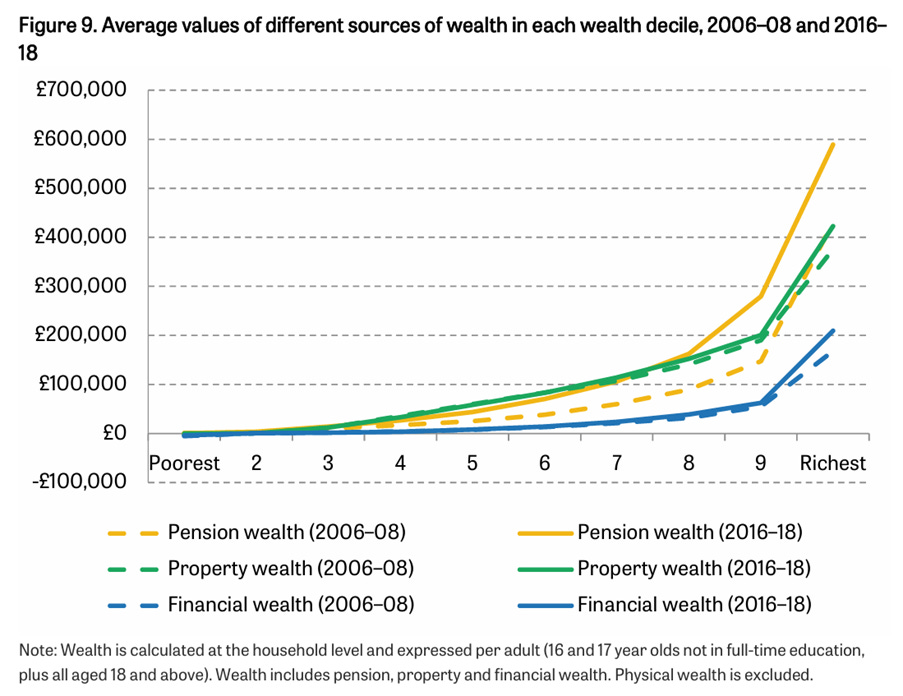
However, this IFS analysis also shows that the fastest-growing source of household wealth since the Global Financial Crisis has been pensions, with the share of household wealth held in pensions rising by 9 percentage points (from 38% to 47%) between 2006-08 and 2016-18. More recent IFS analysis suggests that pension wealth remains an important source of rising household wealth, and may have made a more important contribution than previous estimates would seem to indicate.

Source: Bourquin, P., Brewer, M. and Wernham, T. (2022), ‘Trends in income and wealth inequalities’, IFS Deaton Review of Inequalities
In some ways, the growing importance of pension wealth relative to housing wealth is surely a good thing. Pensions auto-enrollment, which was phased-in between 2012 and 2018, has increased the fraction of the population with some Defined Contribution pension wealth, which represents an increase in active wealth accumulation. In the long-run, auto-enrollment could make housing wealth less important as a source of retirement income. This might reduce political opposition to property tax reforms that aim to increase the amount of residential land value that is taxed rather than privatized.
It is questionable, however, whether the entire increase in the value of pension wealth that has occurred since the introduction of auto-enrollment does in fact represent a real increase in wealth. Although the estimated value of pension pots increased very substantially between 2006-8 and 2016-18, this increase was driven partly by falls in market annuity rates and in the discount rate used by the Office for National Statistics (ONS) to value Defined Benefit pension pots. This means that the sort of guaranteed income in retirement provided by a DB pension is now more expensive to purchase and is estimated to be more valuable than it was, even though this rise in value occurred at the same time as the average income provided by DB pensions actually fell.
In other words, much of the rise in measured pension wealth between 2006–08 and 2016–18 was driven by valuation effects rather than real improvements in retirement living standards. Falling annuity rates and falling discount rates inflated the present value of DB and DC pensions even as actual DB payouts fell.
But what is questionable about the real value of pension wealth is absolutely unquestionable when it comes to the value of land – none of the vast increase in the value of residential land that has occurred since the 1970s represents a real increase in wealth. Land value is a capitalised claim on future economic surplus, not a produced contribution to national wealth. Rising land values redistribute purchasing power but do not increase national wealth.
From the perspective of individual households, the value of residential land certainly seems very much like real wealth – and it is real wealth, if by this we simply mean that it can be sold, borrowed against, or rented out in return for a steady stream of income. But from the perspective of society as a whole, the value of land is not real wealth because it always has a corresponding cost: someone in the economy will have to save more for a deposit or pay higher rent and as a result spend (or invest) less. A rise in the value of land does not mean the nation has produced more goods, built more factories, or advanced its technology. It simply means a larger share of society’s future labor and output has been mortgaged or promised to the owner of that specific location.
Think of it like a poker game. If one player wins a massive pot of chips, they have undeniably accumulated real wealth within the context of that table. But if you look at the room as a whole, the total number of chips hasn’t changed—one person’s gain is strictly balanced by everyone else’s loss. Valuable land acts in much the same way: it is an exceptionally powerful tool for capturing wealth, but its appreciation redistributes existing purchasing power rather than expanding the economic pie.
This is all rather concerning given the massive contribution made by land value both to household wealth and to total UK net worth. Despite the increasing importance of pensions as a source of household wealth, in the most recent period covered by ONS statistics (April 2020 to March 2022), net property wealth still made up the largest proportion of household wealth in Britain (40% compared to 35% private pension wealth). In 2024, ‘non-produced assets’ (explicitly defined by the ONS as land) accounted for almost 55% of the UK’s total net worth of £13.1 trillion, having risen from just under 40% of total UK net worth in 1995.

When more than half of national wealth is land, the balance sheet is not so much measuring productive capacity as who gets to collect the rents. This is why the dominance of land in UK wealth statistics is so alarming: it shows a country inflating its paper wealth while its real economy barely moves, mistaking rising land prices for genuine prosperity. It’s hardly surprising that successive governments have failed to balance the fiscal books, failed to solve the productivity puzzle, and failed to improve the quality of public services.
Why has land made such a worryingly large contribution to household wealth and total UK net worth? Possible explanations include both ‘supply-side’ factors (which constrain new development) and ‘demand-side’ factors (which increase the amount people are prepared to pay for residential and commercial land). Those who focus on the supply-side tend to highlight factors such as high levels of immigration, local opposition to new development (so-called ‘NIMBYism’), rising construction costs, and an overly bureaucratic and restrictive planning system. Those who focus more on the demand-side seek to draw attention to factors like the influx of financial capital from Russian oligarchs and other foreign investors, the ultra-low interest rates that prevailed from 2015 to 2022, the role of the banking system in driving up prices through increases in mortgage debt, and the favourable tax treatment of residential property.
Subsequent Empirical Insights articles will explore these different explanations for the dominance of land in the UK’s balance sheet. The next article will focus on the possible role of supply-side factors, particularly the problems created by the planning system. This is a contentious issue – the forceful arguments of those convinced that the planning system is the principal culprit are vociferously rejected by the detractors of this view. The reality, as we will see, is probably more complicated than commentators on either side seem to think.